Greif Inc. (GEF): Price and Financial Metrics
GET POWR RATINGS... FREE!
GEF POWR Grades
- GEF scores best on the Value dimension, with a Value rank ahead of 86.28% of US stocks.
- GEF's strongest trending metric is Sentiment; it's been moving down over the last 178 days.
- GEF's current lowest rank is in the Sentiment metric (where it is better than 8.47% of US stocks).
GEF Stock Summary
- The capital turnover (annual revenue relative to shareholder's equity) for GEF is 3.28 -- better than 84.52% of US stocks.
- Of note is the ratio of GREIF INC's sales and general administrative expense to its total operating expenses; 98.57% of US stocks have a lower such ratio.
- The volatility of GREIF INC's share price is greater than that of just 8.16% US stocks with at least 200 days of trading history.
- Stocks with similar financial metrics, market capitalization, and price volatility to GREIF INC are HEES, SEB, SENEA, SIRE, and PRIM.
- Visit GEF's SEC page to see the company's official filings. To visit the company's web site, go to www.greif.com.
GEF Valuation Summary
- In comparison to the median Consumer Cyclical stock, GEF's price/sales ratio is 72.22% lower, now standing at 0.5.
- Over the past 243 months, GEF's price/earnings ratio has gone down 7.
Below are key valuation metrics over time for GEF.
Stock | Date | P/S | P/B | P/E | EV/EBIT |
---|---|---|---|---|---|
GEF | 2023-03-16 | 0.5 | 1.5 | 6.1 | 7.8 |
GEF | 2023-03-15 | 0.5 | 1.5 | 6.1 | 7.8 |
GEF | 2023-03-14 | 0.5 | 1.6 | 6.3 | 7.9 |
GEF | 2023-03-13 | 0.5 | 1.6 | 6.4 | 7.9 |
GEF | 2023-03-10 | 0.5 | 1.6 | 6.5 | 8.0 |
GEF | 2023-03-09 | 0.5 | 1.6 | 6.5 | 8.0 |
GEF Growth Metrics
- Its year over year cash and equivalents growth rate is now at -1.54%.
- Its 4 year net income to common stockholders growth rate is now at 78.54%.
- The 4 year net cashflow from operations growth rate now stands at 76.28%.

The table below shows GEF's growth in key financial areas (numbers in millions of US dollars).
Date | Revenue | Operating Cash Flow | Net Income to Common Stock |
---|---|---|---|
2022-09-30 | 6,349.5 | 657.5 | 376.7 |
2022-06-30 | 6,431.9 | 508.2 | 381.7 |
2022-03-31 | 6,300.6 | 393.8 | 352.9 |
2021-12-31 | 5,973.9 | 406.9 | 377.6 |
2021-09-30 | 5,556.1 | 396 | 390.7 |
2021-06-30 | 5,139.2 | 459.1 | 330.6 |
GEF's Quality Factors
The “Quality” component of the POWR Ratings focuses on 31 different factors of a companies fundamentals and operational strength. Here are some key insights as we drill into the specifics of these quality attributes.- GEF has a Quality Grade of B, ranking ahead of 78.83% of graded US stocks.
- GEF's asset turnover comes in at 0.918 -- ranking 4th of 11 Shipping Containers stocks.
- PKG, SON, and WRK are the stocks whose asset turnover ratios are most correlated with GEF.
The table below shows GEF's key quality metrics over time.
Period | Asset Turnover | Gross Margin | ROIC |
---|---|---|---|
2021-07-31 | 0.918 | 0.200 | 0.104 |
2021-04-30 | 0.850 | 0.196 | 0.078 |
2021-01-31 | 0.820 | 0.199 | 0.052 |
2020-10-31 | 0.808 | 0.203 | 0.054 |
2020-07-31 | 0.824 | 0.205 | 0.058 |
2020-04-30 | 0.856 | 0.211 | 0.071 |
GEF Price Target
For more insight on analysts targets of GEF, see our GEF price target page. And for a list of of all stocks sorted by upside potential based on analyst target price, see our Top Price Target page.
Average Price Target | $73.40 | Average Broker Recommendation | 1.9 (Hold) |
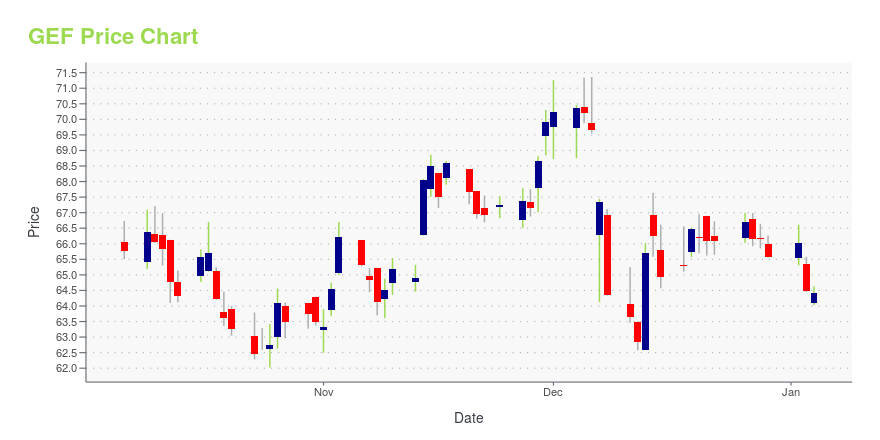
GEF Stock Price Chart Interactive Chart >
GEF Price/Volume Stats
Current price | $60.27 | 52-week high | $74.22 |
Prev. close | $58.16 | 52-week low | $57.10 |
Day low | $58.96 | Volume | 143,646 |
Day high | $60.48 | Avg. volume | 192,010 |
50-day MA | $68.10 | Dividend yield | 3.4% |
200-day MA | $66.74 | Market Cap | 2.86B |
Greif Inc. (GEF) Company Bio
Greif Inc. produces steel, plastic, fibre, flexible, corrugated, multiwall and reconditioned containers, intermediate bulk containers, containerboard and packaging accessories, and provides blending, filling, packaging and industrial packaging reconditioning services for a wide range of industries. The company was founded in 1877 and is based in Delaware, Ohio.
Latest GEF News From Around the Web
Below are the latest news stories about GREIF INC that investors may wish to consider to help them evaluate GEF as an investment opportunity.
Greif, Inc. (NYSE:GEF) Passed Our Checks, And It's About To Pay A US$0.50 DividendGreif, Inc. ( NYSE:GEF ) is about to trade ex-dividend in the next four days. The ex-dividend date is usually set to be... |
Is Greif, Inc. (NYSE:GEF) Potentially Undervalued?Greif, Inc. ( NYSE:GEF ), is not the largest company out there, but it saw significant share price movement during... |
Q1 2023 Greif Inc Earnings CallQ1 2023 Greif Inc Earnings Call |
Greif (GEF) Q1 Earnings Lag Estimates, Dip Y/Y on Low DemandGreif (GEF) misses earnings and revenue estimates for first-quarter fiscal 2023, reflecting lower volumes and selling prices as well as negative impacts caused by foreign currency translation. |
Greif (GEF) Lags Q1 Earnings and Revenue EstimatesGreif (GEF) delivered earnings and revenue surprises of -15.87% and 1.05%, respectively, for the quarter ended January 2023. Do the numbers hold clues to what lies ahead for the stock? |
GEF Price Returns
1-mo | -15.25% |
3-mo | -9.34% |
6-mo | -4.06% |
1-year | -0.87% |
3-year | 151.55% |
5-year | 40.51% |
YTD | -9.36% |
2022 | 14.49% |
2021 | 32.59% |
2020 | 11.61% |
2019 | 24.52% |
2018 | -36.67% |
GEF Dividends
Ex-Dividend Date | Type | Payout Amount | Change | ||||||
---|---|---|---|---|---|---|---|---|---|
Loading, please wait... |
Continue Researching GEF
Here are a few links from around the web to help you further your research on Greif Inc's stock as an investment opportunity:Greif Inc (GEF) Stock Price | Nasdaq
Greif Inc (GEF) Stock Quote, History and News - Yahoo Finance
Greif Inc (GEF) Stock Price and Basic Information | MarketWatch
Loading social stream, please wait...