
Gencor Industries Inc. (GENC): Price and Financial Metrics
GENC Price/Volume Stats
| Current price | $23.08 | 52-week high | $23.26 |
| Prev. close | $22.80 | 52-week low | $13.50 |
| Day low | $22.80 | Volume | 52,700 |
| Day high | $23.26 | Avg. volume | 31,923 |
| 50-day MA | $19.68 | Dividend yield | N/A |
| 200-day MA | $16.84 | Market Cap | 338.35M |
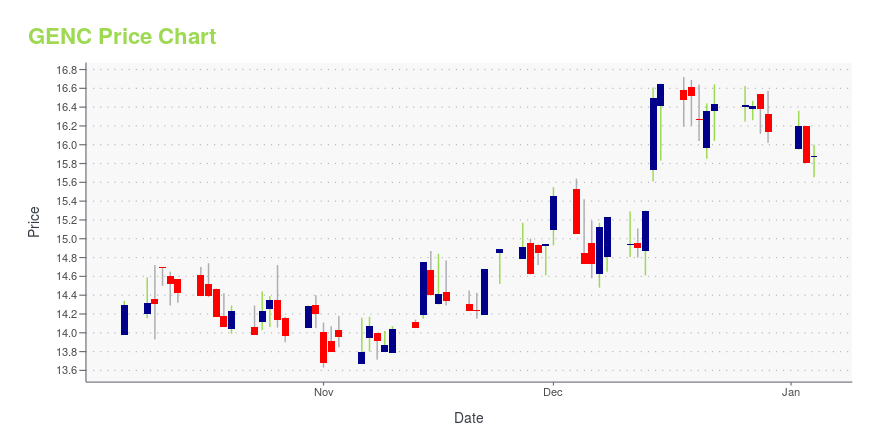
GENC Stock Price Chart Interactive Chart >
Gencor Industries Inc. (GENC) Company Bio
Gencor Industries, Inc. designs, manufactures, and sells heavy machinery used in the production of highway construction materials, synthetic fuels, and environmental control equipment. The company was founded in 1968 and is based in Orlando, Florida.
Latest GENC News From Around the Web
Below are the latest news stories about GENCOR INDUSTRIES INC that investors may wish to consider to help them evaluate GENC as an investment opportunity.
Gencor Releases Third Quarter Fiscal 2023 ResultsORLANDO, Fla., Aug. 09, 2023 (GLOBE NEWSWIRE) -- Gencor Industries, Inc. (the “Company” or “Gencor”) (NYSE American: GENC) announced today net revenues of $27,877,000 for the quarter ended June 30, 2023 compared to $29,647,000 for the quarter ended June 30, 2022. Gross margins for the quarter ended June 30, 2023 were 26.9% compared with 19.2% for the quarter ended June 30, 2022 on increased efficiency, absorption, and favorable price realization. Product engineering and development expenses decr |
Gencor Releases Second Quarter Fiscal 2023 ResultsORLANDO, Fla., May 12, 2023 (GLOBE NEWSWIRE) -- Gencor Industries, Inc. (the “Company” or “Gencor”) (NYSE American LLC: GENC) announced today net revenues of $30,501,000 for the quarter ended March 31, 2023 compared to $30,654,000 for the quarter ended March 31, 2022. Gross profit margins for the quarter ended March 31, 2023 were 29.8% compared with 20.2% for the quarter ended March 31, 2022 on increased efficiency, absorption and favorable price realization. Product engineering and development |
Gencor Releases First Quarter Fiscal 2023 ResultsORLANDO, Fla., Feb. 10, 2023 (GLOBE NEWSWIRE) -- Gencor Industries, Inc. (the “Company” or “Gencor”) (NYSE American: GENC) announced today net revenues increased 28.4% to $25,825,000 for the quarter ended December 31, 2022 compared to $20,106,000 for the quarter ended December 31, 2021, due to higher contract equipment and parts sales. Gross margins were 22.5% for the quarter ended December 31, 2022 compared to 18.4% for the quarter ended December 31, 2021 on increased production and favorable p |
Gencor Releases Fourth Quarter and Fiscal Year 2022 ResultsORLANDO, Fla., Dec. 16, 2022 (GLOBE NEWSWIRE) -- Gencor Industries, Inc. (the “Company” or “Gencor”) (NYSE American: GENC) announced today net revenue for the fourth quarter of 2022 increased 15.5% to $23.1 million compared to $20.0 million for the quarter ended September 30, 2021. The increased net revenues reflect increased shipments and progress on large contract orders where revenue is recognized over time. Gross profit as a percentage of net revenue was 21.5% for the quarter ended September |
GENC Price Returns
| 1-mo | 24.55% |
| 3-mo | 36.00% |
| 6-mo | 48.90% |
| 1-year | 51.74% |
| 3-year | 95.26% |
| 5-year | 78.64% |
| YTD | 43.00% |
| 2023 | 59.80% |
| 2022 | -12.40% |
| 2021 | -6.26% |
| 2020 | 5.40% |
| 2019 | 6.38% |
Continue Researching GENC
Want to see what other sources are saying about Gencor Industries Inc's financials and stock price? Try the links below:Gencor Industries Inc (GENC) Stock Price | Nasdaq
Gencor Industries Inc (GENC) Stock Quote, History and News - Yahoo Finance
Gencor Industries Inc (GENC) Stock Price and Basic Information | MarketWatch
Loading social stream, please wait...