Guardforce AI (GFAI): Price and Financial Metrics
GFAI Price/Volume Stats
Current price | $5.82 | 52-week high | $36.90 |
Prev. close | $5.46 | 52-week low | $3.81 |
Day low | $5.25 | Volume | 1,537,200 |
Day high | $5.93 | Avg. volume | 2,478,945 |
50-day MA | $11.17 | Dividend yield | N/A |
200-day MA | $9.37 | Market Cap | 37.81M |
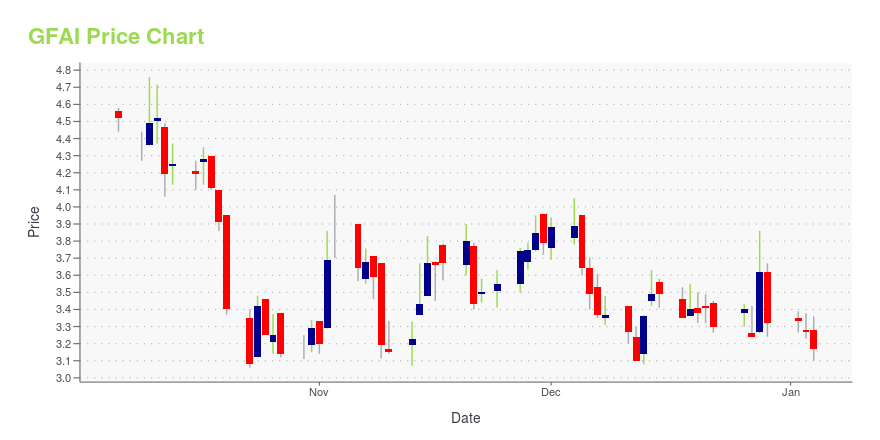
GFAI Stock Price Chart Interactive Chart >
GFAI POWR Grades
- GFAI scores best on the Sentiment dimension, with a Sentiment rank ahead of 96.14% of US stocks.
- The strongest trend for GFAI is in Stability, which has been heading down over the past 98 days.
- GFAI ranks lowest in Quality; there it ranks in the 0th percentile.
GFAI Stock Summary
- In terms of twelve month growth in earnings before interest and taxes, GUARDFORCE AI CO LTD is reporting a growth rate of 776.34%; that's higher than 97.94% of US stocks.
- The volatility of GUARDFORCE AI CO LTD's share price is greater than that of 99.72% US stocks with at least 200 days of trading history.
- GUARDFORCE AI CO LTD's shareholder yield -- a measure of how much capital is returned to stockholders via dividends and buybacks -- is -239.06%, greater than the shareholder yield of only 2.32% of stocks in our set.
- If you're looking for stocks that are quantitatively similar to GUARDFORCE AI CO LTD, a group of peers worth examining would be SNFCA, MCY, NX, CONN, and ACCO.
- To check out GUARDFORCE AI CO LTD's SEC filings, go to the company's page on browse-edgar?action=getcompany&CIK=0001804469.
GFAI Valuation Summary
- GFAI's price/sales ratio is 0.3; this is 84.21% lower than that of the median Industrials stock.
- GFAI's price/sales ratio has moved down 1.9 over the prior 20 months.
Below are key valuation metrics over time for GFAI.
Stock | Date | P/S | P/B | P/E | EV/EBIT |
---|---|---|---|---|---|
GFAI | 2023-05-19 | 0.3 | 0.5 | -0.5 | -1.7 |
GFAI | 2023-05-18 | 0.3 | 0.5 | -0.5 | -1.8 |
GFAI | 2023-05-17 | 0.2 | 0.4 | -0.4 | -1.7 |
GFAI | 2023-05-16 | 0.2 | 0.4 | -0.4 | -1.7 |
GFAI | 2023-05-15 | 0.2 | 0.4 | -0.4 | -1.7 |
GFAI | 2023-05-12 | 0.2 | 0.4 | -0.5 | -1.7 |
Guardforce AI (GFAI) Company Bio
Guardforce AI Co., Limited offers cash solutions and cash handling services in Thailand. The company's services include cash-in-transit, vehicles to banks, ATM management, cash center operations, cash processing, coin processing, and cheque center services, as well as cash deposit machine solutions comprising cash deposit management and express cash services. Its customers include local commercial banks, chain retailers, coin manufacturing mints, and government authorities. The company was incorporated in 2018 and is based in Bangkok, Thailand.
Latest GFAI News From Around the Web
Below are the latest news stories about GUARDFORCE AI CO LTD that investors may wish to consider to help them evaluate GFAI as an investment opportunity.
GDC Stock Alert: Why Is GD Culture Group Up 106% Today?GD Culture (GDC) stock is rocketing higher on Tuesday with investors reacting to the company's earnings report for Q1 2023. |
Why Is Guardforce AI (GFAI) Stock Up Today?Guardforce AI (GFAI) stock is on the rise Tuesday after the AI company announced the closing of a public share offering. |
Guardforce AI Announces Closing of Underwritten Public Offering and Exercise of Full Over-Allotment OptionNEW YORK, May 15, 2023 (GLOBE NEWSWIRE) -- Guardforce AI Co., Limited (“Guardforce AI” or the “Company”) (NASDAQ: GFAI, GFAIW), an integrated security provider specializing in secured logistics, AI and Robot-as-a-Service (RaaS), today announced the closing of its underwritten public offering of 2,580,600 ordinary shares, par value $0.12 per share (the "Ordinary Shares") at a public offering price of $4.65 per share (the “Offering”). The underwriters exercised their over-allotment option in full |
Why Is Neptune Wellness Solutions (NEPT) Stock Down 42% Today?Neptune Wellness Solutions (NEPT) stock is taking a beating on Thursday following an announcement for a public offering. |
Why Is PacWest (PACW) Stock Down 29% Today?PacWest (PACW) stock is taking a beating on Thursday after the regional bank revealed details on deposits and available funds. |
GFAI Price Returns
1-mo | 16.63% |
3-mo | 7.58% |
6-mo | -18.26% |
1-year | -70.96% |
3-year | N/A |
5-year | N/A |
YTD | 14.75% |
2022 | -88.26% |
2021 | N/A |
2020 | N/A |
2019 | N/A |
2018 | N/A |
Loading social stream, please wait...