Gold Fields Ltd. ADR (GFI): Price and Financial Metrics

Gold Fields Ltd. ADR (GFI): $14.09

0.32 (-2.22%)

POWR Rating

Component Grades

Momentum

C

Stability

C

Sentiment

Quality

B

Add GFI to Watchlist
Sign Up

Industry: Miners - Gold

Industry

D

Ranked

#11 of 42

in industry

GFI Price/Volume Stats

Current price $14.09 52-week high $17.78
Prev. close $14.41 52-week low $8.89
Day low $13.91 Volume 4,208,300
Day high $14.28 Avg. volume 5,069,887
50-day MA $13.32 Dividend yield 1.88%
200-day MA $13.55 Market Cap 12.59B

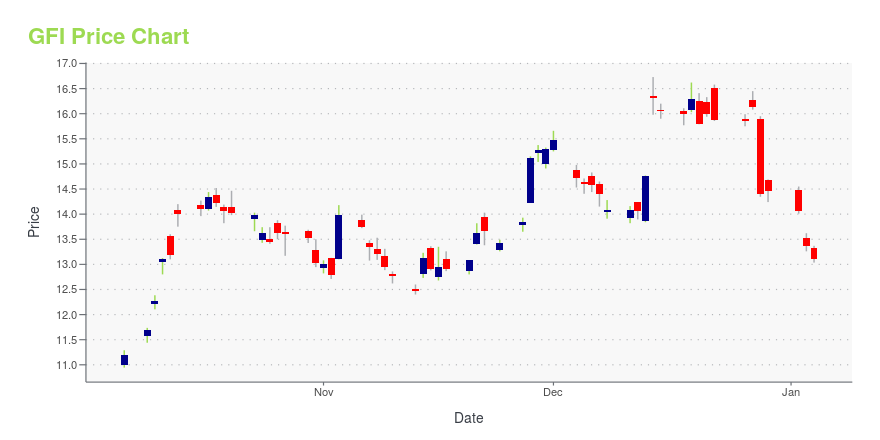
GFI Stock Price Chart Interactive Chart >

GFI POWR Grades

  • Quality is the dimension where GFI ranks best; there it ranks ahead of 78.67% of US stocks.
  • GFI's strongest trending metric is Growth; it's been moving up over the last 177 days.
  • GFI ranks lowest in Sentiment; there it ranks in the 31st percentile.

GFI Stock Summary

  • Of note is the ratio of GOLD FIELDS LTD's sales and general administrative expense to its total operating expenses; only 0.17% of US stocks have a lower such ratio.
  • Over the past twelve months, GFI has reported earnings growth of -475.84%, putting it ahead of just 2.83% of US stocks in our set.
  • Revenue growth over the past 12 months for GOLD FIELDS LTD comes in at 66.29%, a number that bests 92.94% of the US stocks we're tracking.
  • Stocks that are quantitatively similar to GFI, based on their financial statements, market capitalization, and price volatility, are AU, CGAU, NKTR, XPER, and ABSI.
  • Visit GFI's SEC page to see the company's official filings. To visit the company's web site, go to www.goldfields.com.

GFI Valuation Summary

  • GFI's EV/EBIT ratio is 11.7; this is 6.4% lower than that of the median Basic Materials stock.
  • GFI's EV/EBIT ratio has moved down 4.2 over the prior 243 months.

Below are key valuation metrics over time for GFI.

Stock Date P/S P/B P/E EV/EBIT
GFI 2023-11-29 3.2 3.2 19.1 11.7
GFI 2023-11-28 3.1 3.2 19.0 11.6
GFI 2023-11-27 2.9 2.9 17.4 10.6
GFI 2023-11-24 2.8 2.8 16.8 10.3
GFI 2023-11-22 2.8 2.9 17.1 10.5
GFI 2023-11-21 2.8 2.9 17.1 10.5

GFI Growth Metrics

    The 5 year cash and equivalents growth rate now stands at 85.14%.
  • Its 2 year cash and equivalents growth rate is now at 121.87%.
  • Its year over year net income to common stockholders growth rate is now at 9.17%.
Over the past 49 months, GFI's revenue has gone up $1,433,400,000.

The table below shows GFI's growth in key financial areas (numbers in millions of US dollars).

Date Revenue Operating Cash Flow Net Income to Common Stock
2021-12-31 4,195.2 1,230.2 789.3
2020-12-31 3,892.1 1,111.4 723
2019-12-31 2,967.1 845 161.6
2018-12-31 2,577.8 557.8 -348.2
2017-12-31 2,761.8 762.4 -18.7

GFI's Quality Factors

The “Quality” component of the POWR Ratings focuses on 31 different factors of a companies fundamentals and operational strength. Here are some key insights as we drill into the specifics of these quality attributes.
  • GFI has a Quality Grade of B, ranking ahead of 85.35% of graded US stocks.
  • GFI's asset turnover comes in at 0.555 -- ranking 8th of 47 Precious Metals stocks.
  • 500 - Internal server error

The table below shows GFI's key quality metrics over time.

Period Asset Turnover Gross Margin ROIC
2020-12-31 0.555 0.447 0.177
2019-12-31 0.469 0.315 0.063
2018-12-31 0.405 0.207 -0.046
2017-12-31 0.426 0.238 0.035
2016-12-31 0.464 0.248 0.072
2015-12-31 0.415 0.348 -0.019

Gold Fields Ltd. ADR (GFI) Company Bio


Gold Fields Ltd. engages in the exploration, extraction, processing, and smelting of gold and copper properties in South Africa, Ghana, Australia, and Peru. The company was founded in 1887 and is based in Sandton, South Africa.


GFI Latest News Stream


Event/Time News Detail
Loading, please wait...

GFI Latest Social Stream


Loading social stream, please wait...

View Full GFI Social Stream

Latest GFI News From Around the Web

Below are the latest news stories about GOLD FIELDS LTD that investors may wish to consider to help them evaluate GFI as an investment opportunity.

12 Most Undervalued Gold Stocks To Buy According To Hedge Funds

In this piece, we will take a look at the 12 most undervalued gold stocks to buy according to hedge funds. If you want to skip our overview of the gold industry and some recent developments, then take a look at the 5 Most Undervalued Gold Stocks To Buy According To Hedge Funds. The gold […]

Yahoo | November 29, 2023

20 Largest Economies in Africa Ranked by PPP

In this article, we will discuss the 20 largest economies in Africa ranked by PPP. If you want to skip the detailed analysis of the African economy, click 5 Largest Economies in Africa Ranked by PPP. Economic Outlook for Africa African economy holds a huge potential considering its rich natural resources and young human capital. […]

Yahoo | November 21, 2023

Top 20 Gold Mining Companies in the World

This article will highlight the leading companies in gold mining and their current valuation. If you want to skip our overview of the trends and patterns in gold mining, read the Top 5 Gold Mining Companies in the World. In Q3 2023, the demand for gold, excluding over-the-counter transactions, was 8% higher than the five-year […]

Yahoo | November 9, 2023

SQM slashed; Lucid a sell amid plummeting production numbers: 4 big analyst cuts

Here is your Pro Recap of the biggest analyst cuts you may have missed since yesterday: downgrades at Lucid Group, Gold Fields, ArcelorMittal, and Sociedad Quimica y Minera de Chile. CFRA downgraded Lucid Group (NASDAQ:LCID) to Sell from Hold on Tuesday and cut its price target to $4.00 from $7.00 following the company’s Q3 production and delivery numbers.

Yahoo | October 18, 2023

UPDATE 2-Gold Fields names Mike Fraser as CEO, says not changing strategy

South Africa's Gold Fields has appointed Michael Fraser as CEO from January, saying it expects no change in its strategy to find new gold deposits, build mines outside its home country and grow the company in the Americas region. Fraser, a South African, left his role as CEO of AIM-listed Chaarat Gold Holdings on Monday. “He brings a rich and unique mix of global operational and corporate experience and his track record of collaboration in delivering superior results...ideally places him to lead our management team in taking our business forward,” Gold Fields board chairman Yunus Suleman said in a statement.

Yahoo | October 9, 2023

Read More 'GFI' Stories Here

GFI Price Returns

1-mo 8.80%
3-mo 14.74%
6-mo -6.81%
1-year 33.79%
3-year 75.20%
5-year 408.37%
YTD 40.13%
2022 -3.37%
2021 22.41%
2020 42.40%
2019 89.07%
2018 -17.04%

GFI Dividends

Ex-Dividend Date Type Payout Amount Change
Loading, please wait...
View Full GFI Dividend History

Get Free Updates

Join thousands of investors who get the latest news, insights and top rated picks from StockNews.com!