
GlobalFoundries Inc. (GFS): Price and Financial Metrics
GFS Price/Volume Stats
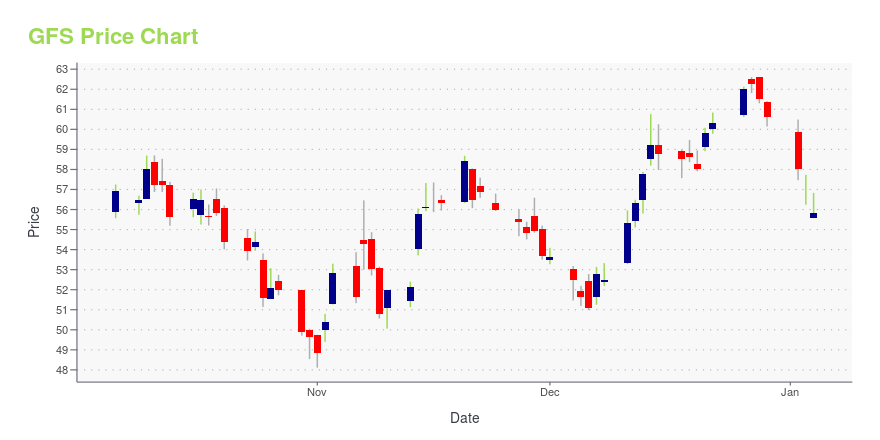
| Current price | $51.75 | 52-week high | $63.85 |
| Prev. close | $50.94 | 52-week low | $45.52 |
| Day low | $51.42 | Volume | 845,217 |
| Day high | $52.36 | Avg. volume | 1,633,425 |
| 50-day MA | $51.77 | Dividend yield | N/A |
| 200-day MA | $53.33 | Market Cap | 28.55B |
GFS Stock Price Chart Interactive Chart >
GlobalFoundries Inc. (GFS) Company Bio
GLOBALFOUNDRIES Inc. operates as a semiconductor foundry worldwide. It manufactures integrated circuits, which enable various electronic devices that are pervasive. The company manufactures a range of semiconductor devices, including microprocessors, mobile application processors, baseband processors, network processors, radio frequency modems, microcontrollers, power management units, and microelectromechanical systems. The company was founded in 2009 and is based in Malta, New York.
Latest GFS News From Around the Web
Below are the latest news stories about GLOBALFOUNDRIES INC that investors may wish to consider to help them evaluate GFS as an investment opportunity.
GLOBALFOUNDRIES Inc.'s (NASDAQ:GFS) Stock's On An Uptrend: Are Strong Financials Guiding The Market?GLOBALFOUNDRIES' (NASDAQ:GFS) stock is up by a considerable 13% over the past month. Given the company's impressive... |
Chip Champions: 3 Semiconductor Stocks to Buy Before the Bull MarketExplore these semiconductor stocks offering unique investment opportunities amidst the semiconductor sector's resurgence. |
Does This Valuation Of GLOBALFOUNDRIES Inc. (NASDAQ:GFS) Imply Investors Are Overpaying?Key Insights Using the 2 Stage Free Cash Flow to Equity, GLOBALFOUNDRIES fair value estimate is US$45.16... |
Is GLOBALFOUNDRIES Inc. (NASDAQ:GFS) Potentially Undervalued?GLOBALFOUNDRIES Inc. ( NASDAQ:GFS ) received a lot of attention from a substantial price increase on the NASDAQGS over... |
GlobalFoundries Named to “America’s Most Responsible Companies 2024” ListMALTA, N.Y., Dec. 13, 2023 (GLOBE NEWSWIRE) -- GlobalFoundries (Nasdaq: GFS) (GF) has been named to Newsweek’s list of “America’s Most Responsible Companies 2024.” It marks the second consecutive year GF was included on Newsweek’s list, and is the latest recognition of GF’s longstanding commitment to ESG (environment, social, and corporate governance) and environmentally sustainable manufacturing. “We are proud to have our ESG efforts recognized and to be included on Newsweek’s list of America’s |
GFS Price Returns
| 1-mo | 1.79% |
| 3-mo | 6.94% |
| 6-mo | -8.41% |
| 1-year | -15.80% |
| 3-year | N/A |
| 5-year | N/A |
| YTD | -14.60% |
| 2023 | 12.45% |
| 2022 | -17.05% |
| 2021 | N/A |
| 2020 | N/A |
| 2019 | N/A |
Loading social stream, please wait...