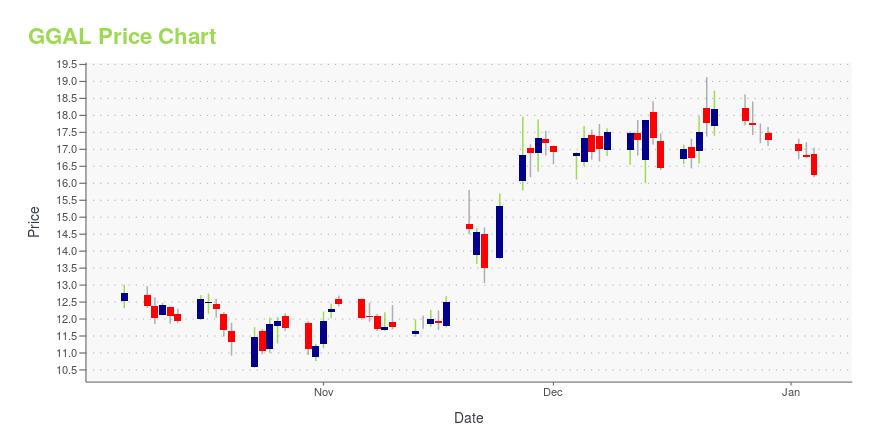
Grupo Financiero Galicia S.A., Class B Shares underlying (GGAL): Price and Financial Metrics
GGAL Price/Volume Stats
| Current price | $47.11 | 52-week high | $74.00 |
| Prev. close | $46.79 | 52-week low | $23.53 |
| Day low | $45.88 | Volume | 322,515 |
| Day high | $47.47 | Avg. volume | 1,278,671 |
| 50-day MA | $55.64 | Dividend yield | 0.55% |
| 200-day MA | $57.33 | Market Cap | 6.95B |
GGAL Stock Price Chart Interactive Chart >
Grupo Financiero Galicia S.A., Class B Shares underlying (GGAL) Company Bio
Grupo Financiero Galicia S.A. operates as a financial services holding company in Argentina. The company operates through Banking, Regional Credit Cards, CFA Personal Loans, and Insurance segments. The company was founded in 1905 and is based in Buenos Aires, Argentina.
GGAL Price Returns
| 1-mo | -13.83% |
| 3-mo | -21.16% |
| 6-mo | -32.28% |
| 1-year | 80.44% |
| 3-year | 788.87% |
| 5-year | 406.82% |
| YTD | -24.05% |
| 2024 | 288.96% |
| 2023 | 92.17% |
| 2022 | 7.31% |
| 2021 | 8.90% |
| 2020 | -45.82% |
GGAL Dividends
| Ex-Dividend Date | Type | Payout Amount | Change | ||||||
|---|---|---|---|---|---|---|---|---|---|
| Loading, please wait... | |||||||||


Loading social stream, please wait...