
Gerdau S.A. (GGB): Price and Financial Metrics
GGB Price/Volume Stats
| Current price | $3.23 | 52-week high | $5.13 |
| Prev. close | $3.24 | 52-week low | $3.06 |
| Day low | $3.17 | Volume | 4,466,503 |
| Day high | $3.25 | Avg. volume | 8,101,675 |
| 50-day MA | $3.36 | Dividend yield | 6.67% |
| 200-day MA | $3.63 | Market Cap | 6.81B |
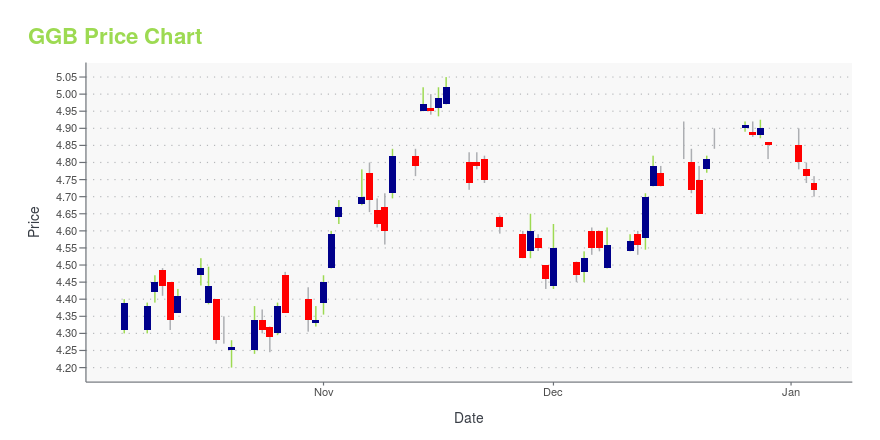
GGB Stock Price Chart Interactive Chart >
Gerdau S.A. (GGB) Company Bio
Gerdau S.A. produces and commercializes steel products worldwide for use in manufacturing, construction, and agricultural industries. The company was founded in 1901 and is based in Porto Alegre, Brazil.
Latest GGB News From Around the Web
Below are the latest news stories about GERDAU SA that investors may wish to consider to help them evaluate GGB as an investment opportunity.
Do Options Traders Know Something About Gerdau (GGB) Stock We Don't?Investors need to pay close attention to Gerdau (GGB) stock based on the movements in the options market lately. |
16 Most Profitable Penny Stocks NowIn this article, we will take a look at the 16 most profitable penny stocks now. To see more such companies, go directly to 5 Most Profitable Penny Stocks Now. Earlier this month investors cheered the latest inflation data report which showed the Fed’s battle against inflation might finally be working. Throughout 2023, investors and […] |
20 Most Valuable Brazilian Companies Heading into 2024In this article, we will take a look at the 20 most valuable Brazilian companies heading into 2024. If you want to skip our detailed analysis, you can go directly to 5 Most Valuable Brazilian Companies Heading into 2024. Brazil’s Economic Outlook: At a Glance According to a report by Deloitte, the Brazilian economy has been […] |
Gerdau S.A. (NYSE:GGB) Q3 2023 Earnings Call TranscriptGerdau S.A. (NYSE:GGB) Q3 2023 Earnings Call Transcript November 7, 2023 Renata Oliva Battiferro: Good afternoon, everyone, and welcome to Investor Relations and our Presentation for the Third Quarter of 2023. My name is Renata, Head of Investor Relations. And participating in our video conference today are the CEO of Gerdau, Gustavo Werneck; and the […] |
GERDAU S.A. - CONSOLIDATED INFORMATIONGERDAU S.A. - CONSOLIDATED INFORMATION |
GGB Price Returns
| 1-mo | -2.12% |
| 3-mo | -9.29% |
| 6-mo | -11.16% |
| 1-year | -31.47% |
| 3-year | -8.56% |
| 5-year | 55.09% |
| YTD | -18.67% |
| 2023 | -2.25% |
| 2022 | 25.92% |
| 2021 | 17.14% |
| 2020 | -3.54% |
| 2019 | 32.85% |
GGB Dividends
| Ex-Dividend Date | Type | Payout Amount | Change | ||||||
|---|---|---|---|---|---|---|---|---|---|
| Loading, please wait... | |||||||||
Continue Researching GGB
Want to see what other sources are saying about Gerdau Sa's financials and stock price? Try the links below:Gerdau Sa (GGB) Stock Price | Nasdaq
Gerdau Sa (GGB) Stock Quote, History and News - Yahoo Finance
Gerdau Sa (GGB) Stock Price and Basic Information | MarketWatch
Loading social stream, please wait...