
Guardant Health, Inc. (GH): Price and Financial Metrics
GH Price/Volume Stats
| Current price | $33.00 | 52-week high | $41.06 |
| Prev. close | $31.93 | 52-week low | $15.81 |
| Day low | $31.80 | Volume | 1,231,875 |
| Day high | $33.53 | Avg. volume | 1,942,227 |
| 50-day MA | $28.97 | Dividend yield | N/A |
| 200-day MA | $24.20 | Market Cap | 4.04B |
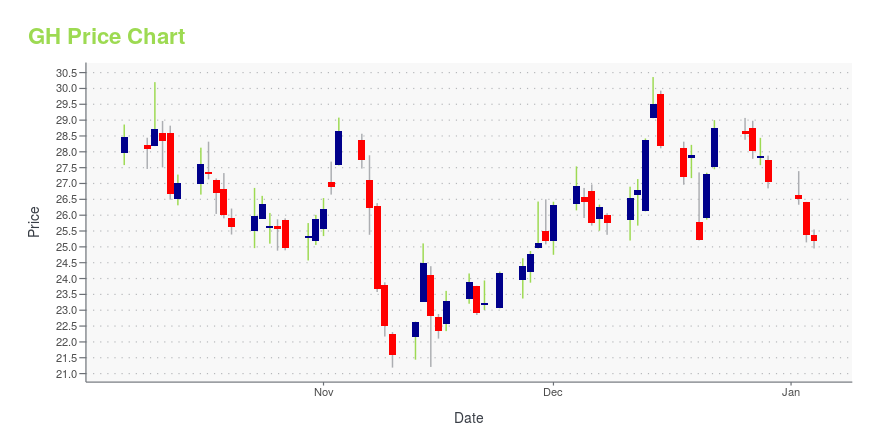
GH Stock Price Chart Interactive Chart >
Guardant Health, Inc. (GH) Company Bio
Guardant Health, Inc., a precision oncology company, provides non-invasive cancer diagnostics. It offers liquid biopsy tests for advanced stage cancer, such as Guardant360, a molecular diagnostic test that measures various cancer-related genes from circulating tumor DNA (ctDNA); and GuardantOMNI, a broader panel measuring various genes from ctDNA. The company also provides LUNAR-1 for recurrence detection in cancer survivors; and LUNAR-2 for early detection of cancer in higher risk individuals. Guardant Health, Inc. was founded in 2011 and is based in Redwood City, California.
Latest GH News From Around the Web
Below are the latest news stories about GUARDANT HEALTH INC that investors may wish to consider to help them evaluate GH as an investment opportunity.
Guardant Health (NASDAQ:GH) shareholders have endured a 78% loss from investing in the stock three years agoGuardant Health, Inc. ( NASDAQ:GH ) shareholders should be happy to see the share price up 13% in the last month. But... |
Guardant Health Announces $90.7 Million Registered Direct Offering with Baillie GiffordPALO ALTO, Calif., December 21, 2023--Guardant Health, Inc. (Nasdaq: GH), a leading precision oncology company, today announced that it has entered into a common stock purchase agreement with Baillie Gifford on behalf of accounts that it manages for the sale of 3,387,446 shares of its common stock in a registered direct offering at an offering price of $26.77 per share. |
Blood-Based Colorectal Cancer CRC Screening Market Likely to Benefit From FDA's Panel Surprise Advisory Possibility: AnalystTuesday, Guardant Health Inc (NASDAQ: GH) announced that the FDA's Molecular and Clinical Genetics Panel of the Medical Devices Advisory Committee is tentatively scheduled to review the premarket approval application (PMA) for its Shield blood test to screen for colorectal cancer on March 28, 2024. Guardant Health submitted the final module of its PMA for Shield on March 10, 2023. The submission includes data from the ECLIPSE study, an over 20,000-patient registrational study evaluating the perf |
Guardant Health to Participate in the 42nd Annual J.P. Morgan Healthcare ConferencePALO ALTO, Calif., December 20, 2023--Guardant Health, Inc. (Nasdaq: GH), a leading precision oncology company, today announced the company will participate in the upcoming 42nd Annual J.P. Morgan Healthcare Conference in San Francisco. |
Guardant Health Announces Tentative Date of FDA Advisory Panel Review of Shield™ Blood TestPALO ALTO, Calif., December 19, 2023--Guardant Health, Inc. (Nasdaq: GH), a leading precision oncology company, today announced that the U.S. Food and Drug Administration’s Molecular and Clinical Genetics Panel of the Medical Devices Advisory Committee is tentatively scheduled to review the premarket approval application (PMA) for the company’s Shield™ blood test to screen for colorectal cancer on March 28, 2024. The date and details of the meeting are subject to confirmation by the FDA and publ |
GH Price Returns
| 1-mo | 12.28% |
| 3-mo | 90.20% |
| 6-mo | 42.86% |
| 1-year | -11.79% |
| 3-year | -69.91% |
| 5-year | -65.97% |
| YTD | 22.00% |
| 2023 | -0.55% |
| 2022 | -72.81% |
| 2021 | -22.39% |
| 2020 | 64.93% |
| 2019 | 107.87% |
Continue Researching GH
Want to do more research on Guardant Health Inc's stock and its price? Try the links below:Guardant Health Inc (GH) Stock Price | Nasdaq
Guardant Health Inc (GH) Stock Quote, History and News - Yahoo Finance
Guardant Health Inc (GH) Stock Price and Basic Information | MarketWatch
Loading social stream, please wait...