
Global Industrial Co. (GIC): Price and Financial Metrics
GIC Price/Volume Stats
| Current price | $23.25 | 52-week high | $45.69 |
| Prev. close | $23.05 | 52-week low | $22.09 |
| Day low | $22.88 | Volume | 73,400 |
| Day high | $23.29 | Avg. volume | 112,040 |
| 50-day MA | $23.91 | Dividend yield | 4.56% |
| 200-day MA | $29.05 | Market Cap | 890.73M |
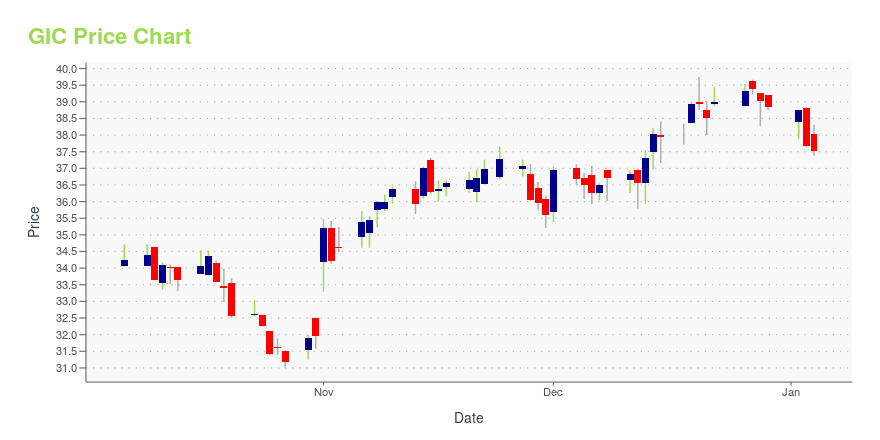
GIC Stock Price Chart Interactive Chart >
GIC Price Returns
| 1-mo | -2.84% |
| 3-mo | -5.07% |
| 6-mo | -30.28% |
| 1-year | -46.27% |
| 3-year | -23.35% |
| 5-year | 77.87% |
| YTD | -5.19% |
| 2024 | -34.30% |
| 2023 | 69.66% |
| 2022 | -40.63% |
| 2021 | 18.77% |
| 2020 | 62.74% |
GIC Dividends
| Ex-Dividend Date | Type | Payout Amount | Change | ||||||
|---|---|---|---|---|---|---|---|---|---|
| Loading, please wait... | |||||||||
Loading social stream, please wait...