
Global Industrial Co. (GIC): Price and Financial Metrics
GIC Price/Volume Stats
| Current price | $35.87 | 52-week high | $46.97 |
| Prev. close | $35.07 | 52-week low | $27.95 |
| Day low | $35.12 | Volume | 59,137 |
| Day high | $35.98 | Avg. volume | 81,901 |
| 50-day MA | $33.21 | Dividend yield | 2.85% |
| 200-day MA | $37.88 | Market Cap | 1.37B |
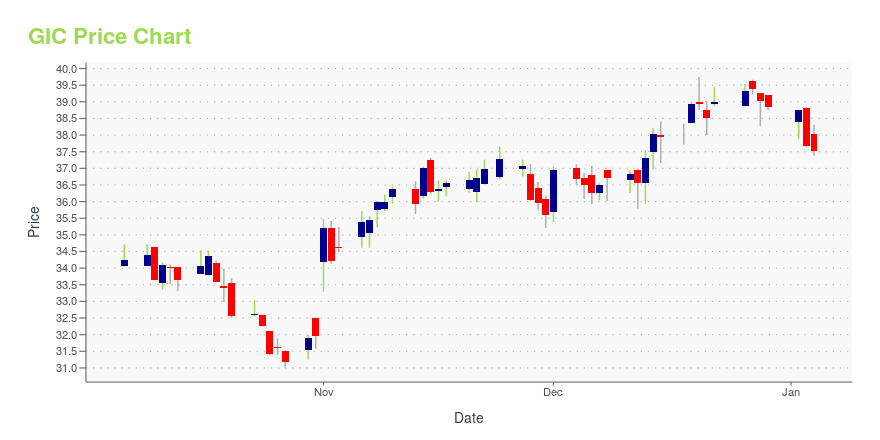
GIC Stock Price Chart Interactive Chart >
Latest GIC News From Around the Web
Below are the latest news stories about GLOBAL INDUSTRIAL CO that investors may wish to consider to help them evaluate GIC as an investment opportunity.
Global Industrial to Participate in the 15th Annual Southwest IDEAS Investor Conference on November 16th in Dallas, TXPORT WASHINGTON, NY / ACCESSWIRE / November 8, 2023 / Global Industrial Company (NYSE:GIC), a value-added national distributor of industrial products and MRO supplies, today announced that Tex Clark, Senior Vice President and Chief Financial Officer, ... |
Global Industrial Announces Floor Care Equipment Agreement with Vizient-Brings Increased Access to Global Industrial's Equipment Selection and Know-How to Vizient Customers-PORT WASHINGTON, NY / ACCESSWIRE / November 7, 2023 / Global Industrial Company (NYSE:GIC), a value-added national distributor of facilities equipment ... |
Global Industrial Company Reports Third Quarter 2023 Financial ResultsSales of $354.6 Million, Increase 18.8%Operating Income of $28.2 Million; Operating Margin 8.0%Board Declares $0.20 DividendPORT WASHINGTON, NY / ACCESSWIRE / October 31, 2023 / Global Industrial Company (NYSE:GIC) today announced financial results ... |
Global Industrial Company and Helen Keller National Center Partner for Global Industrial Corporate Day of ServicePORT WASHINGTON, NY / ACCESSWIRE / October 26, 2023 / Global Industrial Company (NYSE:GIC), a value-added national distributor of industrial products and MRO supplies and the Helen Keller National Center have partnered for an annual day of service. ... |
Global Industrial Company to Report Third Quarter 2023 Results on October 31, 2023PORT WASHINGTON, NY / ACCESSWIRE / October 24, 2023 / Global Industrial Company (NYSE:GIC), a value-added distributor of industrial products and MRO supplies, today announced that it will release financial results for the third quarter ended September ... |
GIC Price Returns
| 1-mo | 15.56% |
| 3-mo | -10.12% |
| 6-mo | -9.96% |
| 1-year | 26.99% |
| 3-year | 4.50% |
| 5-year | 142.63% |
| YTD | -6.48% |
| 2023 | 69.66% |
| 2022 | -40.63% |
| 2021 | 18.77% |
| 2020 | 62.74% |
| 2019 | 7.69% |
GIC Dividends
| Ex-Dividend Date | Type | Payout Amount | Change | ||||||
|---|---|---|---|---|---|---|---|---|---|
| Loading, please wait... | |||||||||
Loading social stream, please wait...