Globe Life Inc. (GL): Price and Financial Metrics
GET POWR RATINGS... FREE!
GL POWR Grades
- GL scores best on the Momentum dimension, with a Momentum rank ahead of 83.39% of US stocks.
- GL's strongest trending metric is Stability; it's been moving down over the last 177 days.
- GL's current lowest rank is in the Value metric (where it is better than 25.21% of US stocks).
GL Stock Summary
- GL has a market capitalization of $11,356,299,236 -- more than approximately 84.6% of US stocks.
- GL's went public 35.12 years ago, making it older than 90.7% of listed US stocks we're tracking.
- Of note is the ratio of GLOBE LIFE INC's sales and general administrative expense to its total operating expenses; just 0.51% of US stocks have a lower such ratio.
- Stocks that are quantitatively similar to GL, based on their financial statements, market capitalization, and price volatility, are CNA, SJR, FRFHF, SSL, and HTLD.
- Visit GL's SEC page to see the company's official filings. To visit the company's web site, go to www.globelifeinsurance.com.
GL Valuation Summary
- GL's price/sales ratio is 2.2; this is 24.14% lower than that of the median Financial Services stock.
- GL's price/earnings ratio has moved up 4.4 over the prior 243 months.
Below are key valuation metrics over time for GL.
Stock | Date | P/S | P/B | P/E | EV/EBIT |
---|---|---|---|---|---|
GL | 2023-01-23 | 2.2 | 2.6 | 16.2 | 14.1 |
GL | 2023-01-20 | 2.2 | 2.6 | 16.2 | 14.1 |
GL | 2023-01-19 | 2.2 | 2.6 | 16.2 | 14.1 |
GL | 2023-01-18 | 2.2 | 2.6 | 16.3 | 14.2 |
GL | 2023-01-17 | 2.3 | 2.7 | 16.6 | 14.4 |
GL | 2023-01-13 | 2.3 | 2.7 | 16.7 | 14.5 |
GL Growth Metrics
- Its 3 year price growth rate is now at 15.56%.
- Its 3 year net income to common stockholders growth rate is now at 2.47%.
- The 4 year net cashflow from operations growth rate now stands at -15.61%.

The table below shows GL's growth in key financial areas (numbers in millions of US dollars).
Date | Revenue | Operating Cash Flow | Net Income to Common Stock |
---|---|---|---|
2022-09-30 | 5,189.597 | 1,428.045 | 706.097 |
2022-06-30 | 5,176.162 | 1,429.031 | 708.189 |
2022-03-31 | 5,154.665 | 1,462.983 | 730.803 |
2021-12-31 | 5,112.869 | 1,437.68 | 744.959 |
2021-09-30 | 5,044.45 | 1,457.84 | 771.246 |
2021-06-30 | 4,961.654 | 1,409.171 | 771.32 |
GL's Quality Factors
The “Quality” component of the POWR Ratings focuses on 31 different factors of a companies fundamentals and operational strength. Here are some key insights as we drill into the specifics of these quality attributes.- GL has a Quality Grade of C, ranking ahead of 45.95% of graded US stocks.
- GL's asset turnover comes in at 0.173 -- ranking 95th of 133 Insurance stocks.
- UNH, DGICA, and FGF are the stocks whose asset turnover ratios are most correlated with GL.
The table below shows GL's key quality metrics over time.
Period | Asset Turnover | Gross Margin | ROIC |
---|---|---|---|
2021-06-30 | 0.173 | 0.452 | 0.034 |
2021-03-31 | 0.173 | 0.450 | 0.034 |
2020-12-31 | 0.172 | 0.457 | 0.034 |
2020-09-30 | 0.174 | 0.461 | 0.034 |
2020-06-30 | 0.176 | 0.469 | 0.036 |
2020-03-31 | 0.178 | 0.476 | 0.037 |
GL Price Target
For more insight on analysts targets of GL, see our GL price target page. And for a list of of all stocks sorted by upside potential based on analyst target price, see our Top Price Target page.
Average Price Target | $108.43 | Average Broker Recommendation | 1.94 (Hold) |
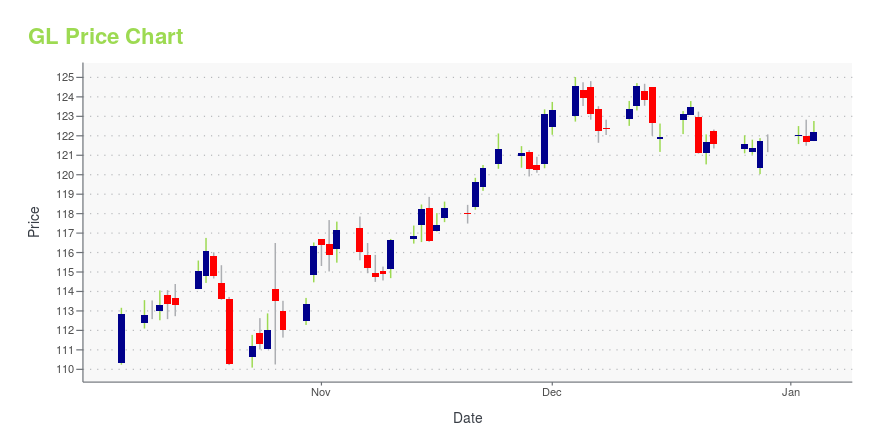
GL Stock Price Chart Interactive Chart >
GL Price/Volume Stats
Current price | $120.16 | 52-week high | $123.85 |
Prev. close | $116.75 | 52-week low | $87.87 |
Day low | $116.64 | Volume | 826,100 |
Day high | $120.18 | Avg. volume | 573,283 |
50-day MA | $119.17 | Dividend yield | 0.69% |
200-day MA | $106.22 | Market Cap | 11.69B |
Globe Life Inc. (GL) Company Bio
Globe Life is a financial services holding company listed on the New York Stock Exchange (GL) which operates through its wholly owned subsidiaries providing life insurance, annuity, and supplemental health insurance products. The company is based in McKinney, Texas. (Source:Wikipedia)
Latest GL News From Around the Web
Below are the latest news stories about GLOBE LIFE INC that investors may wish to consider to help them evaluate GL as an investment opportunity.
Globe Life Inc. (NYSE:GL) Q4 2022 Earnings Call TranscriptGlobe Life Inc. (NYSE:GL) Q4 2022 Earnings Call Transcript February 2, 2023 Operator: Hello, and welcome to the Globe Life Fourth Quarter 2022 Earnings Call. My name is George. I’ll be your coordinator for today’s event. Please note, this conference is being recorded, and for duration of the call your lines will be in a […] |
Globe Life Inc. (GL) Q4 2022 Earnings Call TranscriptGlobe Life Inc. (NYSE:NYSE:GL) Q4 2022 Earnings Conference Call February 2, 2023 10:30 AM ETCompany ParticipantsStephen Mota - Investor Relations DirectorFrank Svoboda - Co-Chief Executive… |
Globe Life: Q4 Earnings SnapshotMCKINNEY, Texas (AP) _ Globe Life Inc. (GL) on Wednesday reported fourth-quarter earnings of $211.6 million. The McKinney, Texas-based company said it had profit of $2.14 per share. Earnings, adjusted for investment costs, were $2.24 per share. The results topped Wall Street expectations. The average estimate of six analysts surveyed by Zacks Investment Research was for earnings of $2.18 per share. The life and health insurance company posted revenue of $1.32 billion in the period. Its adjusted revenue was $1.33 billion, which matched Street forecasts. For the year, the company reported profit of $739.7 million, or $7.47 per share. Revenue was reported as $5.29 billion. Globe Life expects full-year earnings in the range of $10.20 to $10.50 per share. _____ This story was generated by Au... |
Globe Life Q4 Non-GAAP EPS beats, revenue misses, FY23 guidance above consensusGlobe Life press release (GL): Q4 Non-GAAP EPS of $2.24 beats by $0.07.Revenue of $1.32B (+1.5% Y/Y) misses by $10M.Globe Life projects net operating income between $10.20 to $10.50… |
Globe Life Inc. Q4 Profit Increases, beats estimatesWASHINGTON (dpa-AFX) - Globe Life Inc. (GL) reported earnings for its fourth quarter that increased from the same period last year and beat the Street estimates.The company''s bottom line came in a… |
GL Price Returns
1-mo | -2.60% |
3-mo | 6.11% |
6-mo | 20.41% |
1-year | 16.60% |
3-year | 14.10% |
5-year | 50.10% |
YTD | -0.15% |
2022 | 29.68% |
2021 | -0.48% |
2020 | -8.92% |
2019 | 42.34% |
2018 | -17.23% |
GL Dividends
Ex-Dividend Date | Type | Payout Amount | Change | ||||||
---|---|---|---|---|---|---|---|---|---|
Loading, please wait... |
Loading social stream, please wait...