
General Motors Co. (GM): Price and Financial Metrics
GM Price/Volume Stats
| Current price | $44.12 | 52-week high | $50.50 |
| Prev. close | $44.13 | 52-week low | $26.30 |
| Day low | $43.66 | Volume | 18,410,436 |
| Day high | $44.55 | Avg. volume | 16,021,127 |
| 50-day MA | $46.47 | Dividend yield | 1.03% |
| 200-day MA | $39.35 | Market Cap | 50.34B |
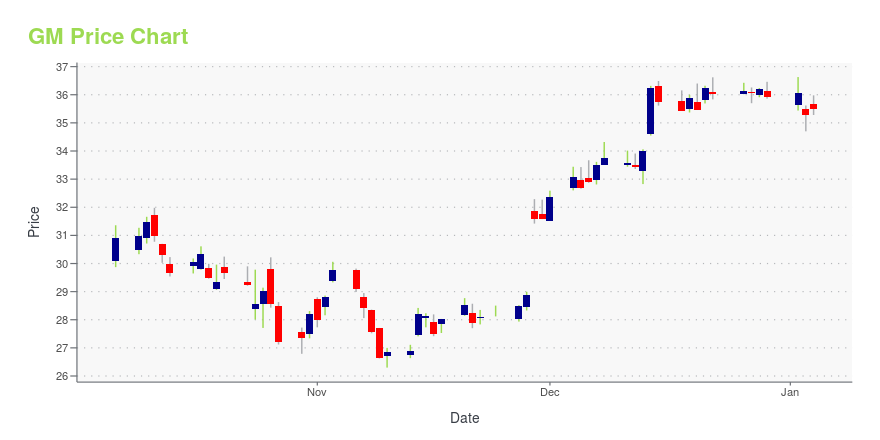
GM Stock Price Chart Interactive Chart >
General Motors Co. (GM) Company Bio
General Motors Company is an American multinational corporation that designs, builds, and sells cars, trucks, and automobile parts. GM was founded in 1908 by William C. Durant and has over 155,000 worldwide employees, of which 85,000 reside in the United States. The company also provides automotive financing services through General Motors Financial Company, Inc. GM operates over 120 manufacturing facilities and 4,200 dealerships in the United States. Headquartered in Detroit, Michigan, the company’s vehicle brands include Chevrolet, Buick, Cadillac, and GMC. Mary T. Barra serves as GM’s Chair of the Board and has been the Chief Executive Officer since January 15, 2014.
Latest GM News From Around the Web
Below are the latest news stories about GENERAL MOTORS CO that investors may wish to consider to help them evaluate GM as an investment opportunity.
The 3 Hottest EV Stocks to Watch in 2024If you want to make the most of the transition towards EV, here are the hot EV stocks to keep an eye on as they soar higher. |
Wall Street Says These 3 Magnificent 7 Stocks Will Crash in 2024Only a handful of stocks drove the market higher and these are the Magnificent 7 stocks to avoid in 2024 according to analysts. |
2024 Market Predictions: 2 Trends Destined to Crash, One Set to SoarTrends come and go on Wall Street, so two of this years hottest growth opportunities may fall flat next year. |
7 Stocks to Buy if the Fed Goes Through With Interest Rate CutsWhile inflation may have been the theme of 2022, disinflation could be the defining label for the outgoing year, thus warranting a closer examination of stocks to buy for lower interest rates. |
Top 3 Automotive Stock Picks for the New YearThese automotive stock picks could see a significant upside in 2024 and generate solid gains for you throughout the year. |
GM Price Returns
| 1-mo | -3.60% |
| 3-mo | -3.50% |
| 6-mo | 26.12% |
| 1-year | 14.48% |
| 3-year | -18.10% |
| 5-year | 14.17% |
| YTD | 23.52% |
| 2023 | 7.92% |
| 2022 | -42.36% |
| 2021 | 40.80% |
| 2020 | 15.16% |
| 2019 | 14.02% |
GM Dividends
| Ex-Dividend Date | Type | Payout Amount | Change | ||||||
|---|---|---|---|---|---|---|---|---|---|
| Loading, please wait... | |||||||||
Continue Researching GM
Here are a few links from around the web to help you further your research on General Motors Co's stock as an investment opportunity:General Motors Co (GM) Stock Price | Nasdaq
General Motors Co (GM) Stock Quote, History and News - Yahoo Finance
General Motors Co (GM) Stock Price and Basic Information | MarketWatch
Loading social stream, please wait...