
Gamida Cell Ltd. - Ordinary Shares (GMDA): Price and Financial Metrics
GMDA Price/Volume Stats
| Current price | $0.03 | 52-week high | $2.51 |
| Prev. close | $0.04 | 52-week low | $0.03 |
| Day low | $0.03 | Volume | 23,036,800 |
| Day high | $0.04 | Avg. volume | 9,201,723 |
| 50-day MA | $0.32 | Dividend yield | N/A |
| 200-day MA | $0.76 | Market Cap | 5.04M |
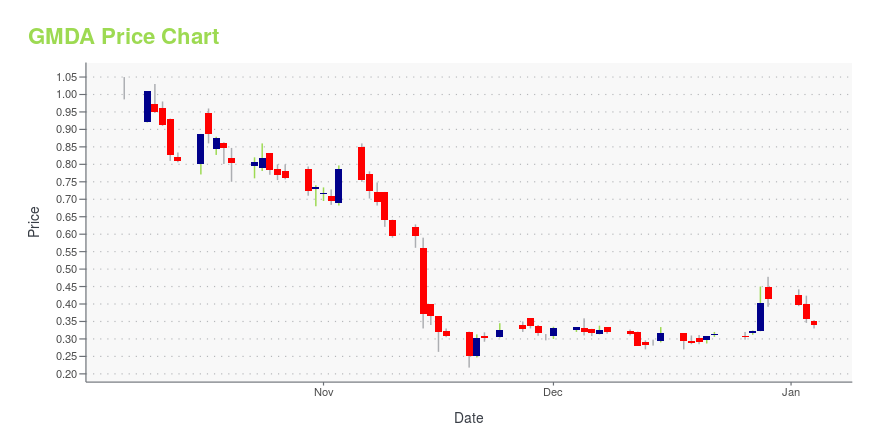
GMDA Stock Price Chart Interactive Chart >
Gamida Cell Ltd. - Ordinary Shares (GMDA) Company Bio
Gamida Cell Ltd. is a clinical stage biopharmaceutical company, which engages in the development of cell therapies that are designed to cure cancer and rare serious hematologic diseases. Its products pipeline include NiCord and NAM-NK. The company was founded by Tony Peled and Menashe Levy in 1998 and is headquartered in Jerusalem, Israel.
Latest GMDA News From Around the Web
Below are the latest news stories about GAMIDA CELL LTD that investors may wish to consider to help them evaluate GMDA as an investment opportunity.
Gamida Cell to Host Virtual Thought Leader Fireside Chat on December 4, 2023BOSTON, Nov. 27, 2023 (GLOBE NEWSWIRE) -- Gamida Cell Ltd. (Nasdaq: GMDA), a cell therapy pioneer working to turn cells into powerful therapeutics, is hosting a virtual fireside chat with thought leader Gary Schiller, MD, FACP, Professor of Medicine and Director of the Hematological Malignancy & Stem Cell Transplant Program at the David Geffen School of Medicine at University of California – Los Angeles. Dr. Schiller will discuss his experience working with patients in need of allogeneic stem ce |
Gamida Cell to Present Corporate Highlights at the Piper Sandler 35th Annual Healthcare ConferenceBOSTON, Nov. 20, 2023 (GLOBE NEWSWIRE) -- Gamida Cell Ltd. (Nasdaq: GMDA), a cell therapy pioneer working to turn cells into powerful therapeutics, today announced that its management team will present corporate highlights at the upcoming Piper Sandler 35th Annual Healthcare Conference in New York, NY. Presentation Details Format:Fireside ChatDate/Time:Tuesday, November 28, 2023 at 11:00 –11:25 AM ETWebcast:Click here. The Gamida Cell management team will be available for one-on-one meetings dur |
Gamida Cell Ltd. (NASDAQ:GMDA) Q3 2023 Earnings Call TranscriptGamida Cell Ltd. (NASDAQ:GMDA) Q3 2023 Earnings Call Transcript November 14, 2023 Gamida Cell Ltd. beats earnings expectations. Reported EPS is $-0.01, expectations were $-0.15. Operator: Ladies and gentlemen, thank you for standing by. Welcome to Gamida Cell’s Conference Call for Third Quarter 2023 Financial Results. My name is Chris, and I’ll be your operator […] |
Q3 2023 Gamida Cell Ltd Earnings CallQ3 2023 Gamida Cell Ltd Earnings Call |
Gamida Cell Reports Third Quarter 2023 Financial Results and Provides Company UpdateCompany continues to advance launch, reports initial revenue from Omisirge® (omidubicel-onlv) Company to host conference call today at 8:30 a.m. ET BOSTON, Nov. 14, 2023 (GLOBE NEWSWIRE) -- Gamida Cell Ltd. (Nasdaq: GMDA), a cell therapy pioneer working to turn cells into powerful therapeutics, today reported financial results for the quarter ended September 30, 2023, and provided a business update. “The third quarter marked the first patients receiving Omisirge following FDA approval and the po |
GMDA Price Returns
| 1-mo | N/A |
| 3-mo | N/A |
| 6-mo | -91.77% |
| 1-year | -97.73% |
| 3-year | -99.38% |
| 5-year | -99.20% |
| YTD | -92.73% |
| 2023 | -68.01% |
| 2022 | -49.21% |
| 2021 | -69.73% |
| 2020 | 95.12% |
| 2019 | -56.74% |
Loading social stream, please wait...