Globus Medical, Inc. (GMED): Price and Financial Metrics
GET POWR RATINGS... FREE!
GMED POWR Grades
- Growth is the dimension where GMED ranks best; there it ranks ahead of 95.31% of US stocks.
- GMED's strongest trending metric is Stability; it's been moving up over the last 177 days.
- GMED's current lowest rank is in the Sentiment metric (where it is better than 31.48% of US stocks).
GMED Stock Summary
- Price to trailing twelve month operating cash flow for GMED is currently 39.35, higher than 87.58% of US stocks with positive operating cash flow.
- The ratio of debt to operating expenses for GLOBUS MEDICAL INC is higher than it is for about only 0.48% of US stocks.
- Equity multiplier, or assets relative to shareholders' equity, comes in at 1.12 for GLOBUS MEDICAL INC; that's greater than it is for merely 10.01% of US stocks.
- If you're looking for stocks that are quantitatively similar to GLOBUS MEDICAL INC, a group of peers worth examining would be LMAT, NSSC, CTS, LOGI, and MASI.
- Visit GMED's SEC page to see the company's official filings. To visit the company's web site, go to www.globusmedical.com.
GMED Valuation Summary
- In comparison to the median Healthcare stock, GMED's price/sales ratio is 260.98% higher, now standing at 7.4.
- Over the past 127 months, GMED's EV/EBIT ratio has gone up 28.4.
Below are key valuation metrics over time for GMED.
Stock | Date | P/S | P/B | P/E | EV/EBIT |
---|---|---|---|---|---|
GMED | 2023-01-20 | 7.4 | 4.2 | 47.6 | 38.2 |
GMED | 2023-01-19 | 7.2 | 4.1 | 46.5 | 37.3 |
GMED | 2023-01-18 | 7.2 | 4.1 | 46.3 | 37.2 |
GMED | 2023-01-17 | 7.3 | 4.1 | 46.9 | 37.6 |
GMED | 2023-01-13 | 7.4 | 4.2 | 47.9 | 38.4 |
GMED | 2023-01-12 | 7.4 | 4.2 | 47.3 | 38.0 |
GMED Growth Metrics
- Its 2 year revenue growth rate is now at 21.22%.
- Its 4 year net income to common stockholders growth rate is now at 40.84%.
- Its 5 year cash and equivalents growth rate is now at -8.84%.

The table below shows GMED's growth in key financial areas (numbers in millions of US dollars).
Date | Revenue | Operating Cash Flow | Net Income to Common Stock |
---|---|---|---|
2022-09-30 | 998.366 | 190.746 | 155.211 |
2022-06-30 | 973.939 | 235.088 | 154.991 |
2022-03-31 | 961.307 | 257.394 | 141.946 |
2021-12-31 | 958.102 | 276.274 | 149.191 |
2021-09-30 | 941.526 | 280.205 | 187.042 |
2021-06-30 | 927.903 | 256.191 | 184.047 |
GMED's Quality Factors
The “Quality” component of the POWR Ratings focuses on 31 different factors of a companies fundamentals and operational strength. Here are some key insights as we drill into the specifics of these quality attributes.- GMED has a Quality Grade of B, ranking ahead of 90.91% of graded US stocks.
- GMED's asset turnover comes in at 0.547 -- ranking 84th of 186 Medical Equipment stocks.
- OFIX, SRTS, and ESMC are the stocks whose asset turnover ratios are most correlated with GMED.
The table below shows GMED's key quality metrics over time.
Period | Asset Turnover | Gross Margin | ROIC |
---|---|---|---|
2021-06-30 | 0.547 | 0.745 | 0.189 |
2021-03-31 | 0.514 | 0.729 | 0.131 |
2020-12-31 | 0.512 | 0.724 | 0.111 |
2020-09-30 | 0.510 | 0.732 | 0.103 |
2020-06-30 | 0.504 | 0.741 | 0.096 |
2020-03-31 | 0.542 | 0.764 | 0.165 |
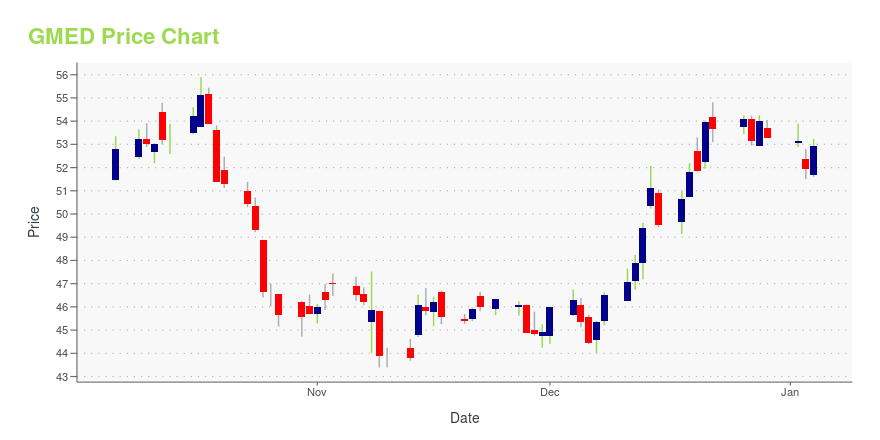
GMED Stock Price Chart Interactive Chart >
GMED Price/Volume Stats
Current price | $75.18 | 52-week high | $81.78 |
Prev. close | $74.04 | 52-week low | $52.60 |
Day low | $74.04 | Volume | 287,500 |
Day high | $75.26 | Avg. volume | 491,812 |
50-day MA | $72.60 | Dividend yield | N/A |
200-day MA | $65.06 | Market Cap | 7.51B |
Globus Medical, Inc. (GMED) Company Bio
Globus Medical focuses on the design, development, and commercialization of musculoskeletal implants that promote healing in patients with spine disorders. The company was founded in 2003 and is based in Audubon, Pennsylvania.
Latest GMED News From Around the Web
Below are the latest news stories about GLOBUS MEDICAL INC that investors may wish to consider to help them evaluate GMED as an investment opportunity.
Here's Why Investors Should Retain Globus Medical (GMED) StockInvestors are optimistic about Globus Medical's (GMED) robust performance across several international markets. |
15 Largest Orthopedic Companies in the WorldIn this article, we will take a look at the 15 largest orthopedic companies in the world. If you want to see more companies in this selection, go to the 5 Largest Orthopedic Companies in the World. The orthopedic industry has staged a comeback in the last two years following a dismal 2020 due to […] |
Globus Medical, Inc. (NYSE:GMED) Stock Is Going Strong But Fundamentals Look Uncertain: What Lies Ahead ?Globus Medical (NYSE:GMED) has had a great run on the share market with its stock up by a significant 21% over the last... |
Globus Medical Stock: A Long-Term Investment (NYSE:GMED)Globus Medical develops compelling solutions for patients with musculoskeletal disorders. Read more to see GMED''s product pipeline and why it''s a long-term buy. |
Globus Medical (GMED) Global Growth Strong Despite Margin WoeDespite continued margin declines in Japan, Globus Medical (GMED) remains positive on the progress and potential of its international business for long-term growth as it continues to reset the market in the country. |
GMED Price Returns
1-mo | 3.30% |
3-mo | 11.86% |
6-mo | 28.10% |
1-year | 18.06% |
3-year | 40.47% |
5-year | 59.75% |
YTD | 1.23% |
2022 | 2.87% |
2021 | 10.70% |
2020 | 10.77% |
2019 | 36.04% |
2018 | 5.30% |
Continue Researching GMED
Want to do more research on Globus Medical Inc's stock and its price? Try the links below:Globus Medical Inc (GMED) Stock Price | Nasdaq
Globus Medical Inc (GMED) Stock Quote, History and News - Yahoo Finance
Globus Medical Inc (GMED) Stock Price and Basic Information | MarketWatch
Loading social stream, please wait...