GMS Inc. (GMS): Price and Financial Metrics
GET POWR RATINGS... FREE!
GMS POWR Grades
- GMS scores best on the Momentum dimension, with a Momentum rank ahead of 93.93% of US stocks.
- GMS's strongest trending metric is Stability; it's been moving up over the last 177 days.
- GMS ranks lowest in Stability; there it ranks in the 57th percentile.
GMS Stock Summary
- GMS INC's capital turnover -- a measure of revenue relative to shareholder's equity -- is better than 89.02% of US listed stocks.
- With a price/sales ratio of 0.49, GMS INC has a higher such ratio than only 14.08% of stocks in our set.
- Over the past twelve months, GMS has reported earnings growth of 70.33%, putting it ahead of 81.48% of US stocks in our set.
- Stocks that are quantitatively similar to GMS, based on their financial statements, market capitalization, and price volatility, are UNVR, BCC, MOD, HIBB, and AMN.
- GMS's SEC filings can be seen here. And to visit GMS INC's official web site, go to www.gms.com.
GMS Valuation Summary
- GMS's price/sales ratio is 0.5; this is 61.54% lower than that of the median Basic Materials stock.
- Over the past 81 months, GMS's price/sales ratio has gone down 0.
Below are key valuation metrics over time for GMS.
Stock | Date | P/S | P/B | P/E | EV/EBIT |
---|---|---|---|---|---|
GMS | 2023-01-31 | 0.5 | 2.1 | 7.5 | 7.3 |
GMS | 2023-01-30 | 0.4 | 2.0 | 7.1 | 7.1 |
GMS | 2023-01-27 | 0.5 | 2.0 | 7.2 | 7.1 |
GMS | 2023-01-26 | 0.5 | 2.0 | 7.2 | 7.1 |
GMS | 2023-01-25 | 0.4 | 2.0 | 7.0 | 7.0 |
GMS | 2023-01-24 | 0.4 | 1.9 | 6.8 | 6.9 |
GMS Growth Metrics
- Its 3 year price growth rate is now at 108.12%.
- The 5 year cash and equivalents growth rate now stands at 1348.45%.
- The 4 year net cashflow from operations growth rate now stands at 354.34%.

The table below shows GMS's growth in key financial areas (numbers in millions of US dollars).
Date | Revenue | Operating Cash Flow | Net Income to Common Stock |
---|---|---|---|
2022-09-30 | 5,232.78 | 359.567 | 330.502 |
2022-06-30 | 4,952.352 | 250.285 | 301.71 |
2022-03-31 | 4,634.875 | 179.611 | 273.442 |
2021-12-31 | 4,278.425 | 64.921 | 230.692 |
2021-09-30 | 3,876.021 | 52.161 | 185.435 |
2021-06-30 | 3,538.326 | 93.938 | 139.543 |
GMS's Quality Factors
The “Quality” component of the POWR Ratings focuses on 31 different factors of a companies fundamentals and operational strength. Here are some key insights as we drill into the specifics of these quality attributes.- GMS has a Quality Grade of C, ranking ahead of 74.63% of graded US stocks.
- GMS's asset turnover comes in at 1.473 -- ranking 54th of 105 Wholesale stocks.
- MEDS, CENT, and WSTG are the stocks whose asset turnover ratios are most correlated with GMS.
The table below shows GMS's key quality metrics over time.
Period | Asset Turnover | Gross Margin | ROIC |
---|---|---|---|
2021-07-31 | 1.473 | 0.322 | 0.116 |
2021-04-30 | 1.439 | 0.322 | 0.098 |
2021-01-31 | 1.398 | 0.325 | 0.059 |
2020-10-31 | 1.404 | 0.327 | 0.056 |
2020-07-31 | 1.414 | 0.328 | 0.057 |
2020-04-30 | 1.426 | 0.328 | 0.056 |
GMS Price Target
For more insight on analysts targets of GMS, see our GMS price target page. And for a list of of all stocks sorted by upside potential based on analyst target price, see our Top Price Target page.
Average Price Target | $61.00 | Average Broker Recommendation | 1.57 (Moderate Buy) |
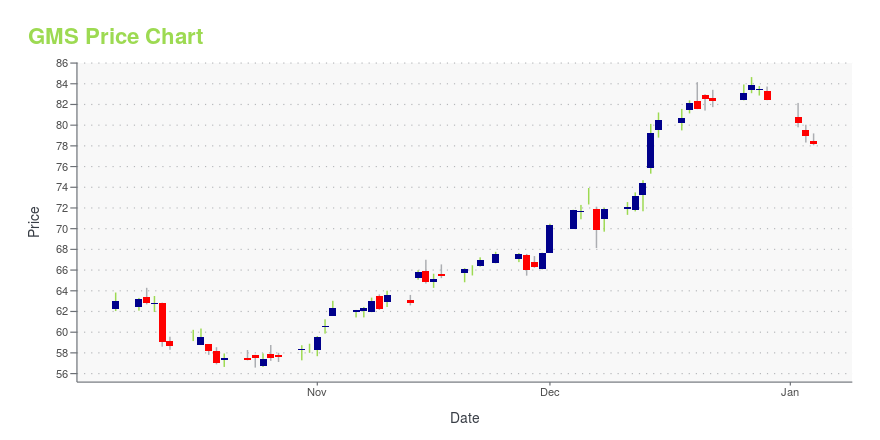
GMS Stock Price Chart Interactive Chart >
GMS Price/Volume Stats
Current price | $60.50 | 52-week high | $61.76 |
Prev. close | $61.04 | 52-week low | $36.10 |
Day low | $59.55 | Volume | 95,088 |
Day high | $60.68 | Avg. volume | 205,820 |
50-day MA | $52.87 | Dividend yield | N/A |
200-day MA | $48.52 | Market Cap | 2.52B |
GMS Inc. (GMS) Company Bio
GMS Inc. distributes gypsum wallboard, acoustical ceiling products, and other specialty building materials to the interior contractors of commercial and residential buildings in North America. The company was founded in 1971 and is based Tucker, Georgia.
Latest GMS News From Around the Web
Below are the latest news stories about GMS INC that investors may wish to consider to help them evaluate GMS as an investment opportunity.
GMS Inc.: Stock Seeks To Outperform Peers With New Product OfferingsQ2 2023 saw GMS increase its net sale of wallpaper, ceilings, and complementary products versus Q2 2022. See why the stock is a Buy. |
When Should You Buy GMS Inc. (NYSE:GMS)?While GMS Inc. ( NYSE:GMS ) might not be the most widely known stock at the moment, it received a lot of attention from... |
GMS Buys Tanner & Opens Greenfield Locations, Gives AMES UpdateGMS benefits from strategic initiatives, strong commercial activity and backlog. |
GMS Enters New York City Market With New Acquisition & Greenfield LocationSpecialty building products distributor GMS Inc (NYSE: GMS ) has expanded its platform with its first entries in the New York City market. The company has acquired Tanner Bolt and Nut Inc. and opened a ceilings-focused greenfield location. The financial terms were not disclosed. Tanner Bolt and Nut Inc distributes … Full story available on Benzinga.com |
GMS Enters the New York City Market with the Acquisition of Tanner Bolt and Nut, Inc. and a Ceilings-Focused Greenfield; Also Details Further Platform Expansion ActivityTUCKER, Ga., January 03, 2023--GMS Inc. (NYSE: GMS), a leading North American specialty building products distributor, today provided an update on the continued execution of its platform expansion strategy with its first entries in the New York City market. These include the acquisition of Tanner Bolt and Nut, Inc. and the opening of a ceilings-focused greenfield location. In addition, the Company provided details on other recent openings of greenfield yards and AMES store locations. |
GMS Price Returns
1-mo | 17.27% |
3-mo | 30.67% |
6-mo | 13.81% |
1-year | 21.27% |
3-year | 134.22% |
5-year | 81.46% |
YTD | 21.49% |
2022 | -17.15% |
2021 | 97.21% |
2020 | 12.56% |
2019 | 82.23% |
2018 | -60.52% |
Continue Researching GMS
Want to do more research on GMS Inc's stock and its price? Try the links below:GMS Inc (GMS) Stock Price | Nasdaq
GMS Inc (GMS) Stock Quote, History and News - Yahoo Finance
GMS Inc (GMS) Stock Price and Basic Information | MarketWatch
Loading social stream, please wait...