Grocery Outlet Holding Corp. (GO): Price and Financial Metrics

Grocery Outlet Holding Corp. (GO): $28.72

0.20 (+0.70%)

POWR Rating

Component Grades

Momentum

F

Stability

C

Sentiment

Quality

C

Add GO to Watchlist
Sign Up

Industry: Grocery/Big Box Retailers

Industry

A

Ranked

#32 of 37

in industry

GO Price/Volume Stats

Current price $28.72 52-week high $46.37
Prev. close $28.52 52-week low $25.71
Day low $28.39 Volume 856,000
Day high $29.13 Avg. volume 965,920
50-day MA $29.11 Dividend yield N/A
200-day MA $31.24 Market Cap 2.82B

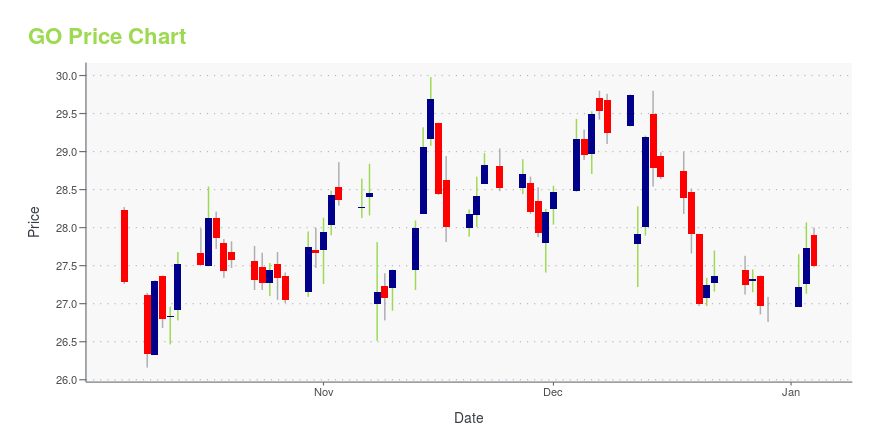
GO Stock Price Chart Interactive Chart >

GO POWR Grades

  • GO scores best on the Growth dimension, with a Growth rank ahead of 77.85% of US stocks.
  • GO's strongest trending metric is Momentum; it's been moving down over the last 179 days.
  • GO's current lowest rank is in the Momentum metric (where it is better than 1.86% of US stocks).

GO Stock Summary

  • The capital turnover (annual revenue relative to shareholder's equity) for GO is 3.29 -- better than 84.12% of US stocks.
  • With a one year PEG ratio of 297.56, GROCERY OUTLET HOLDING CORP is expected to have a higher PEG ratio (a measure of how expensive a stock is relative to its expected earnings growth) than 91.62% of US stocks.
  • GO's current price/earnings ratio is 44.04, which is higher than 85.9% of US stocks with positive earnings.
  • Stocks that are quantitatively similar to GO, based on their financial statements, market capitalization, and price volatility, are CHX, ADUS, CACI, OPCH, and PCYG.
  • Visit GO's SEC page to see the company's official filings. To visit the company's web site, go to www.groceryoutlet.com.

GO Valuation Summary

  • GO's price/sales ratio is 0.8; this is 55.56% lower than that of the median Consumer Defensive stock.
  • GO's price/sales ratio has moved down 0.2 over the prior 48 months.

Below are key valuation metrics over time for GO.

Stock Date P/S P/B P/E EV/EBIT
GO 2023-05-23 0.8 2.6 43.9 41.7
GO 2023-05-22 0.8 2.6 43.7 41.6
GO 2023-05-19 0.8 2.7 44.7 42.2
GO 2023-05-18 0.8 2.7 44.8 42.3
GO 2023-05-17 0.8 2.7 44.6 42.2
GO 2023-05-16 0.8 2.7 44.6 42.2

GO's Quality Factors

The “Quality” component of the POWR Ratings focuses on 31 different factors of a companies fundamentals and operational strength. Here are some key insights as we drill into the specifics of these quality attributes.
  • GO has a Quality Grade of C, ranking ahead of 50.48% of graded US stocks.
  • GO's asset turnover comes in at 1.246 -- ranking 108th of 165 Retail stocks.
  • 500 - Internal server error

The table below shows GO's key quality metrics over time.

Period Asset Turnover Gross Margin ROIC
2021-07-03 1.246 0.307 0.040
2021-04-03 1.289 0.310 0.042
2021-01-02 1.317 0.311 0.041
2020-09-26 1.294 0.311 0.038
2020-06-27 1.282 0.311 0.037
2020-03-28 1.245 0.308 0.024

GO Price Target

For more insight on analysts targets of GO, see our GO price target page. And for a list of of all stocks sorted by upside potential based on analyst target price, see our Top Price Target page.

Average Price Target $33.50 Average Broker Recommendation 1.87 (Hold)

Grocery Outlet Holding Corp. (GO) Company Bio


Grocery Outlet Holding Corp. engages in the operation of retail stores. It offers name-brand consumables and fresh products through a network of independently operated stores. The company was founded by Jim Read in 1946 and is headquartered in Emeryville, CA.


GO Latest News Stream


Event/Time News Detail
Loading, please wait...

GO Latest Social Stream


Loading social stream, please wait...

View Full GO Social Stream

Latest GO News From Around the Web

Below are the latest news stories about GROCERY OUTLET HOLDING CORP that investors may wish to consider to help them evaluate GO as an investment opportunity.

GO vs. CHWY: Which Stock Is the Better Value Option?

GO vs. CHWY: Which Stock Is the Better Value Option?

Yahoo | May 16, 2023

As Grocery Outlet Holding (NASDAQ:GO) increases 5.9% this past week, investors may now be noticing the company's three-year earnings growth

As an investor its worth striving to ensure your overall portfolio beats the market average. But its virtually certain...

Yahoo | May 11, 2023

Grocery Outlet (GO) Beats on Q1 Earnings, Raises FY23 View

Grocery Outlet's (GO) first-quarter results reflect a comparable store sales increase of 12.1%. Management anticipates comparable store sales growth of 5% to 6% for 2023.

Yahoo | May 10, 2023

Grocery Outlet (GO) Q1 2023 Earnings Call Transcript

It is now my pleasure to introduce the host, John Rouleau. Good afternoon, and welcome to Grocery Outlet call to discuss financial results for the first quarter ending March 31, 2023. Speaking from management on today's call will be RJ Sheedy, president and chief executive officer; and Charles Bracher, chief financial officer.

Yahoo | May 10, 2023

Grocery Outlet Holding Corp. (GO) Beats Q1 Earnings and Revenue Estimates

Grocery Outlet Holding Corp. (GO) delivered earnings and revenue surprises of 17.39% and 1.79%, respectively, for the quarter ended March 2023. Do the numbers hold clues to what lies ahead for the stock?

Yahoo | May 9, 2023

Read More 'GO' Stories Here

GO Price Returns

1-mo -6.05%
3-mo 4.02%
6-mo -6.30%
1-year -24.72%
3-year -20.29%
5-year N/A
YTD -1.61%
2022 3.22%
2021 -27.95%
2020 20.96%
2019 N/A
2018 N/A

Get Free Updates

Join thousands of investors who get the latest news, insights and top rated picks from StockNews.com!