Gladstone Commercial Corporation - Real Estate Investment Trust (GOOD): Price and Financial Metrics
GET POWR RATINGS... FREE!
GOOD POWR Grades
- GOOD scores best on the Growth dimension, with a Growth rank ahead of 92.94% of US stocks.
- The strongest trend for GOOD is in Momentum, which has been heading up over the past 179 days.
- GOOD ranks lowest in Value; there it ranks in the 20th percentile.
GOOD Stock Summary
- GOOD's one year PEG ratio, measuring expected growth in earnings next year relative to current common stock price is 1,515.11 -- higher than 97.89% of US-listed equities with positive expected earnings growth.
- Of note is the ratio of Gladstone Commercial Corp's sales and general administrative expense to its total operating expenses; merely 3.21% of US stocks have a lower such ratio.
- For GOOD, its debt to operating expenses ratio is greater than that reported by 91.8% of US equities we're observing.
- Stocks with similar financial metrics, market capitalization, and price volatility to Gladstone Commercial Corp are OPI, NEN, IDA, NWN, and FRO.
- GOOD's SEC filings can be seen here. And to visit Gladstone Commercial Corp's official web site, go to www.gladstonecommercial.com.
GOOD Valuation Summary
- GOOD's price/earnings ratio is -2590.7; this is 6999.33% lower than that of the median Real Estate stock.
- Over the past 220 months, GOOD's price/earnings ratio has gone up 7763.8.
- GOOD's EV/EBIT ratio has moved up 7700.3 over the prior 220 months.
Below are key valuation metrics over time for GOOD.
Stock | Date | P/S | P/B | P/E | EV/EBIT |
---|---|---|---|---|---|
GOOD | 2021-09-02 | 6.2 | 4.1 | -2590.7 | 36.7 |
GOOD | 2021-09-01 | 6.2 | 4.1 | -2587.3 | 36.7 |
GOOD | 2021-08-31 | 6.2 | 4.1 | -2574.6 | 36.6 |
GOOD | 2021-08-30 | 6.2 | 4.1 | -2564.4 | 36.5 |
GOOD | 2021-08-27 | 6.2 | 4.1 | -2554.2 | 36.4 |
GOOD | 2021-08-26 | 6.1 | 4.0 | -2521.4 | 36.2 |
GOOD Growth Metrics
- Its year over year net cashflow from operations growth rate is now at -8.66%.
- The 2 year net income to common stockholders growth rate now stands at -46.73%.
- The 4 year revenue growth rate now stands at 40.41%.

The table below shows GOOD's growth in key financial areas (numbers in millions of US dollars).
Date | Revenue | Operating Cash Flow | Net Income to Common Stock |
---|---|---|---|
2021-12-31 | 137.688 | 70.126 | -4.554 |
2021-09-30 | 135.247 | 66.803 | 1.244 |
2021-06-30 | 134.055 | 64.47 | -0.323 |
2021-03-31 | 134.209 | 62.043 | 0.81 |
2020-12-31 | 133.152 | 65.494 | 3.149 |
2020-09-30 | 129.672 | 69.512 | -7.949 |
GOOD's Quality Factors
The “Quality” component of the POWR Ratings focuses on 31 different factors of a companies fundamentals and operational strength. Here are some key insights as we drill into the specifics of these quality attributes.- GOOD has a Quality Grade of C, ranking ahead of 52.72% of graded US stocks.
- GOOD's asset turnover comes in at 0.124 -- ranking 37th of 63 Real Estate stocks.
- VAC, INVH, and KW are the stocks whose asset turnover ratios are most correlated with GOOD.
The table below shows GOOD's key quality metrics over time.
Period | Asset Turnover | Gross Margin | ROIC |
---|---|---|---|
2021-09-30 | 0.124 | 0.723 | 0.026 |
2021-06-30 | 0.123 | 0.723 | 0.025 |
2021-03-31 | 0.123 | 0.728 | 0.024 |
2020-12-31 | 0.122 | 0.730 | 0.026 |
2020-09-30 | 0.121 | 0.752 | 0.021 |
2020-06-30 | 0.119 | 0.772 | 0.022 |
GOOD Price Target
For more insight on analysts targets of GOOD, see our GOOD price target page. And for a list of of all stocks sorted by upside potential based on analyst target price, see our Top Price Target page.
Average Price Target | $25.00 | Average Broker Recommendation | 1.33 (Strong Buy) |
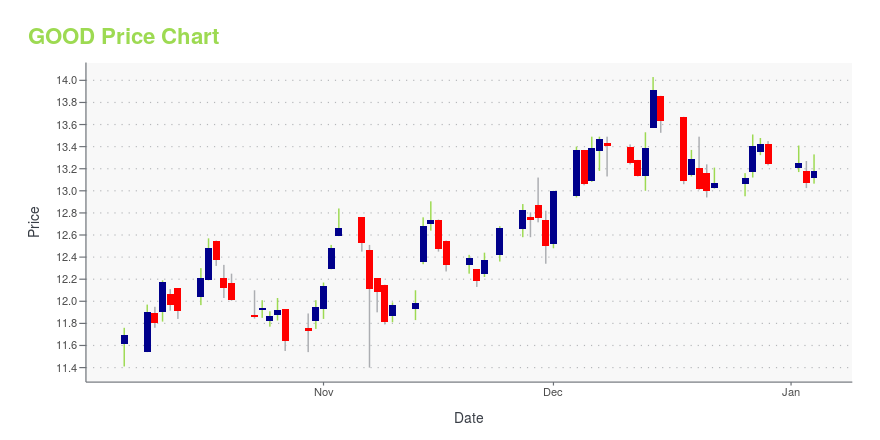
GOOD Stock Price Chart Interactive Chart >
GOOD Price/Volume Stats
Current price | $19.01 | 52-week high | $26.13 |
Prev. close | $18.91 | 52-week low | $18.23 |
Day low | $18.67 | Volume | 225,500 |
Day high | $19.23 | Avg. volume | 245,118 |
50-day MA | $21.30 | Dividend yield | 7.89% |
200-day MA | $22.26 | Market Cap | 734.72M |
Gladstone Commercial Corporation - Real Estate Investment Trust (GOOD) Company Bio
Gladstone Commercial Corporation operates as a real estate investment trust (REIT) in the United States. It engages in investing in and owning net leased industrial and commercial real properties, and making long-term industrial and commercial mortgage loans. The company was founded in 2003 and is based in McLean, Virginia.
Latest GOOD News From Around the Web
Below are the latest news stories about Gladstone Commercial Corp that investors may wish to consider to help them evaluate GOOD as an investment opportunity.
Gladstone Commercial Announces $7.4 Million Industrial Acquisition in Wilkesboro, NCMCLEAN, VA / ACCESSWIRE / February 24, 2022 / Gladstone Commercial Corporation (Nasdaq:GOOD) ("Gladstone Commercial") acquired an 80,000 square foot industrial facility, located on 9.2 acres in Wilkesboro, North Carolina, for $7. |
How Safe Is Gladstone Commercial's Dividend?Gladstone Commercial is one of the highest-yielding real estate investment trusts (REITs) today, but is its 7% dividend worth it? |
Analysts Conflicted on These Financial Names: Gladstone Commercial (GOOD) and Community Healthcare (CHCT)Companies in the Financial sector have received a lot of coverage today as analysts weigh in on Gladstone Commercial (GOOD – Research Report) and Community Healthcare (CHCT – Research Report). Gladstone Commercial (GOOD) Colliers Securities analyst Barry Oxford reiterated a Buy rating on Gladstone Commercial today and set a price target of $26.00. The company's shares closed last Tuesday at $21.59. According to TipRanks. |
Gladstone Commercial (GOOD) Q4 FFO Surpass EstimatesGladstone Commercial (GOOD) delivered FFO and revenue surprises of 2.56% and 3.59%, respectively, for the quarter ended December 2021. Do the numbers hold clues to what lies ahead for the stock? |
Gladstone Commercial core FFO strengthened by rental income, occupancyGladstone Commercial (NASDAQ:GOOD) fourth-quarter funds from operations was helped by rental income growth and same store occupancy. Q4 core FFO of $0.40 per share matched the consensus and ticked higher from $0.39 in the third quarter. Q4 operating revenue of $35.30M edged higher from $34.33M in Q3. Square feet leased... |
GOOD Price Returns
1-mo | -15.31% |
3-mo | -9.88% |
6-mo | -12.97% |
1-year | -1.98% |
3-year | 10.90% |
5-year | 36.17% |
YTD | -24.10% |
2021 | 53.51% |
2020 | -9.60% |
2019 | 30.02% |
2018 | -7.82% |
2017 | 12.41% |
GOOD Dividends
Ex-Dividend Date | Type | Payout Amount | Change | ||||||
---|---|---|---|---|---|---|---|---|---|
Loading, please wait... |
Continue Researching GOOD
Want to see what other sources are saying about Gladstone Commercial Corp's financials and stock price? Try the links below:Gladstone Commercial Corp (GOOD) Stock Price | Nasdaq
Gladstone Commercial Corp (GOOD) Stock Quote, History and News - Yahoo Finance
Gladstone Commercial Corp (GOOD) Stock Price and Basic Information | MarketWatch
Loading social stream, please wait...