Alphabet Inc. (GOOG): Price and Financial Metrics
GOOG Price/Volume Stats
| Current price | $195.32 | 52-week high | $208.70 |
| Prev. close | $195.75 | 52-week low | $142.66 |
| Day low | $194.68 | Volume | 19,010,100 |
| Day high | $198.70 | Avg. volume | 24,289,646 |
| 50-day MA | $180.15 | Dividend yield | 0.44% |
| 200-day MA | $0.00 | Market Cap | 2.36T |
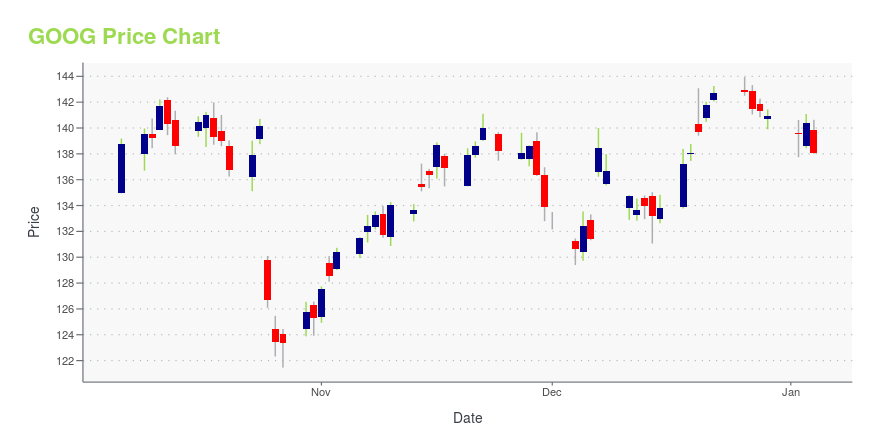
GOOG Stock Price Chart Interactive Chart >
Alphabet Inc. (GOOG) Company Bio
Google offers a range of products across screens and devices. The Company delivers both performance advertising and brand advertising. The Performance advertising creates and delivers relevant ads, which leads to direct engagement with advertisers. The company was founded in 1998 and is based in Mountain View, California.
GOOG Price Returns
| 1-mo | N/A |
| 3-mo | 27.98% |
| 6-mo | 1.28% |
| 1-year | 22.17% |
| 3-year | 66.20% |
| 5-year | 161.96% |
| YTD | 2.80% |
| 2024 | 35.62% |
| 2023 | 58.83% |
| 2022 | -38.67% |
| 2021 | 65.17% |
| 2020 | 31.03% |
GOOG Dividends
| Ex-Dividend Date | Type | Payout Amount | Change | ||||||
|---|---|---|---|---|---|---|---|---|---|
| Loading, please wait... | |||||||||


Loading social stream, please wait...