Group 1 Automotive, Inc. (GPI): Price and Financial Metrics
GET POWR RATINGS... FREE!
GPI POWR Grades
- GPI scores best on the Value dimension, with a Value rank ahead of 98.89% of US stocks.
- GPI's strongest trending metric is Sentiment; it's been moving down over the last 177 days.
- GPI's current lowest rank is in the Sentiment metric (where it is better than 11.84% of US stocks).
GPI Stock Summary
- The capital turnover (annual revenue relative to shareholder's equity) for GPI is 7.25 -- better than 94.51% of US stocks.
- GPI's current price/earnings ratio is 3.93, which is higher than just 7.69% of US stocks with positive earnings.
- With a price/sales ratio of 0.18, GROUP 1 AUTOMOTIVE INC has a higher such ratio than just 5.37% of stocks in our set.
- Stocks that are quantitatively similar to GPI, based on their financial statements, market capitalization, and price volatility, are BIG, ODP, RYI, GPS, and ABG.
- Visit GPI's SEC page to see the company's official filings. To visit the company's web site, go to www.group1auto.com.
GPI Valuation Summary
- GPI's EV/EBIT ratio is 5.7; this is 56.15% lower than that of the median Consumer Cyclical stock.
- GPI's price/sales ratio has moved up 0.1 over the prior 243 months.
Below are key valuation metrics over time for GPI.
Stock | Date | P/S | P/B | P/E | EV/EBIT |
---|---|---|---|---|---|
GPI | 2023-03-22 | 0.2 | 1.3 | 3.9 | 5.7 |
GPI | 2023-03-21 | 0.2 | 1.3 | 3.9 | 5.8 |
GPI | 2023-03-20 | 0.2 | 1.3 | 3.9 | 5.7 |
GPI | 2023-03-17 | 0.2 | 1.3 | 3.8 | 5.7 |
GPI | 2023-03-16 | 0.2 | 1.3 | 3.9 | 5.7 |
GPI | 2023-03-15 | 0.2 | 1.3 | 3.8 | 5.7 |
GPI Growth Metrics
- The 4 year net income to common stockholders growth rate now stands at 12.55%.
- Its 3 year cash and equivalents growth rate is now at -50.63%.
- The year over year cash and equivalents growth rate now stands at -79.98%.

The table below shows GPI's growth in key financial areas (numbers in millions of US dollars).
Date | Revenue | Operating Cash Flow | Net Income to Common Stock |
---|---|---|---|
2022-09-30 | 15,415.4 | 675.5 | 681.6 |
2022-06-30 | 14,761.2 | 867.7 | 658 |
2022-03-31 | 14,316.2 | 1,247.1 | 653.1 |
2021-12-31 | 13,481.9 | 1,259.6 | 552.1 |
2021-09-30 | 13,209.7 | 1,210.2 | 565.1 |
2021-06-30 | 12,740.1 | 869.3 | 519.4 |
GPI's Quality Factors
The “Quality” component of the POWR Ratings focuses on 31 different factors of a companies fundamentals and operational strength. Here are some key insights as we drill into the specifics of these quality attributes.- GPI has a Quality Grade of B, ranking ahead of 79.5% of graded US stocks.
- GPI's asset turnover comes in at 2.673 -- ranking 19th of 165 Retail stocks.
- KMX, LE, and TITN are the stocks whose asset turnover ratios are most correlated with GPI.
The table below shows GPI's key quality metrics over time.
Period | Asset Turnover | Gross Margin | ROIC |
---|---|---|---|
2021-09-30 | 2.673 | 0.173 | 0.187 |
2021-06-30 | 2.549 | 0.168 | 0.168 |
2021-03-31 | 2.234 | 0.165 | 0.122 |
2020-12-31 | 2.131 | 0.163 | 0.102 |
2020-09-30 | 2.105 | 0.160 | 0.087 |
2020-06-30 | 2.085 | 0.154 | 0.065 |
GPI Price Target
For more insight on analysts targets of GPI, see our GPI price target page. And for a list of of all stocks sorted by upside potential based on analyst target price, see our Top Price Target page.
Average Price Target | $256.00 | Average Broker Recommendation | 1.5 (Moderate Buy) |
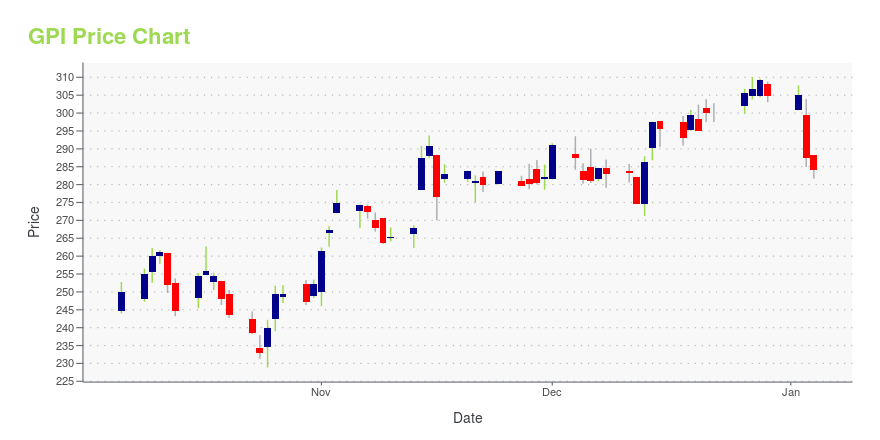
GPI Stock Price Chart Interactive Chart >
GPI Price/Volume Stats
Current price | $221.46 | 52-week high | $242.68 |
Prev. close | $215.53 | 52-week low | $136.16 |
Day low | $217.38 | Volume | 104,500 |
Day high | $222.56 | Avg. volume | 180,339 |
50-day MA | $217.44 | Dividend yield | 0.84% |
200-day MA | $185.32 | Market Cap | 3.15B |
Group 1 Automotive, Inc. (GPI) Company Bio
Group 1 Automotive operates in the automotive retail industry. It sells new and used cars, light trucks, and vehicle parts; arranges vehicle financing; sells service and insurance contracts; and provides automotive maintenance and repair services. The company was founded in 1995 and is based in Houston, Texas.
Latest GPI News From Around the Web
Below are the latest news stories about GROUP 1 AUTOMOTIVE INC that investors may wish to consider to help them evaluate GPI as an investment opportunity.
Here's Why We Think Group 1 Automotive (NYSE:GPI) Is Well Worth WatchingThe excitement of investing in a company that can reverse its fortunes is a big draw for some speculators, so even... |
Group 1 Automotive Acquires Chevrolet Dealership in Estero, FloridaGroup 1 Automotive, Inc. (NYSE: GPI) ("Group 1" or the "Company"), an international, Fortune 300 automotive retailer with 205 dealerships located in the U.S. and U.K., today announced the expansion of its U.S. operations with the acquisition of Estero Bay Chevrolet in Estero, Florida. The dealership is located near the fast growing city of Fort Myers in Southwest Florida. Estero Bay Chevrolet is the 5th ranked Chevrolet dealership in new vehicle volume in the state of Florida. The dealership is |
Should Value Investors Buy Group 1 Automotive (GPI) Stock?Here at Zacks, our focus is on the proven Zacks Rank system, which emphasizes earnings estimates and estimate revisions to find great stocks. Nevertheless, we are always paying attention to the latest value, growth, and momentum trends to underscore strong picks. |
10 Best Used Car Stocks To Buy According to Hedge FundsIn this article, we discuss 10 best used car stocks to buy according to hedge funds. If you want to skip the detailed analysis of the used cars industry, go directly to 5 Best Used Car Stocks To Buy According to Hedge Funds. The used car market is surprisingly large and is growing at a […] |
Did Group 1 Automotive, Inc. (NYSE:GPI) Use Debt To Deliver Its ROE Of 34%?While some investors are already well versed in financial metrics (hat tip), this article is for those who would like... |
GPI Price Returns
1-mo | -3.15% |
3-mo | 23.03% |
6-mo | 55.64% |
1-year | 33.04% |
3-year | 410.74% |
5-year | 256.24% |
YTD | 23.03% |
2022 | -6.85% |
2021 | 50.05% |
2020 | 31.93% |
2019 | 92.36% |
2018 | -24.57% |
GPI Dividends
Ex-Dividend Date | Type | Payout Amount | Change | ||||||
---|---|---|---|---|---|---|---|---|---|
Loading, please wait... |
Continue Researching GPI
Want to see what other sources are saying about Group 1 Automotive Inc's financials and stock price? Try the links below:Group 1 Automotive Inc (GPI) Stock Price | Nasdaq
Group 1 Automotive Inc (GPI) Stock Quote, History and News - Yahoo Finance
Group 1 Automotive Inc (GPI) Stock Price and Basic Information | MarketWatch
Loading social stream, please wait...