
Green Plains Partners LP (GPP): Price and Financial Metrics
GPP Price/Volume Stats
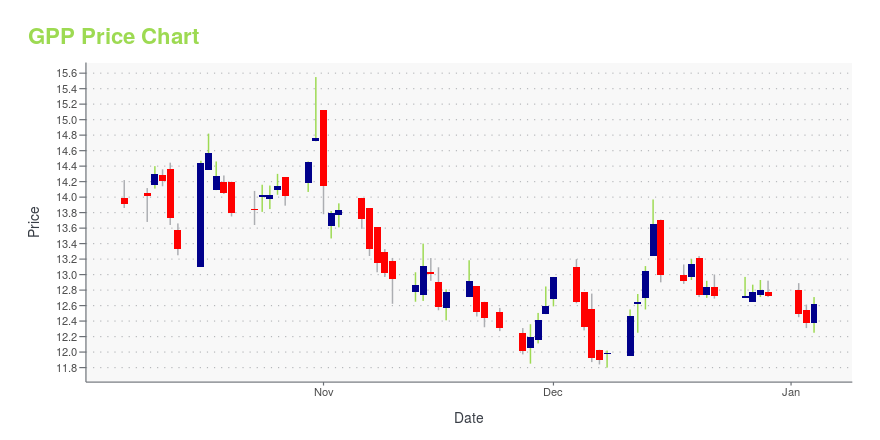
| Current price | $12.31 | 52-week high | $16.25 |
| Prev. close | $12.38 | 52-week low | $11.72 |
| Day low | $12.15 | Volume | 257,400 |
| Day high | $12.59 | Avg. volume | 288,300 |
| 50-day MA | $12.90 | Dividend yield | 14.78% |
| 200-day MA | $13.25 | Market Cap | 286.39M |
GPP Stock Price Chart Interactive Chart >
Green Plains Partners LP (GPP) Company Bio
Green Plains Partners LP owns, operates, develops, and acquires ethanol and fuel storage tanks, terminals, and transportation assets. The company was founded in 2007 and is based in Omaha, Nebraska.
Latest GPP News From Around the Web
Below are the latest news stories about GREEN PLAINS PARTNERS LP that investors may wish to consider to help them evaluate GPP as an investment opportunity.
12 Most Promising Clean Energy Stocks According to AnalystsIn this piece, we will take a look at the 12 most promising clean energy stocks according to analysts. If you want to skip our analysis of the clean energy industry and the latest news, then take a look at 5 Most Promising Clean Energy Stocks According to Analysts. The clean energy industry made up […] |
Mighty Minis: 7 Small-Cap Stocks That Punch Above Their WeightWhile your typical financial advisor will likely direct you to focus on established blue chips to boost your holdings, few other compelling options exist other than powerful small-cap stocks. To be 100% clear, entities that offer significant upside reward potential usually carry significant risks. You want to be careful about diving into this space. That said, small-cap market leaders provide many advantages. Sure, they may lack the capitalization of their blue-chip peers. However, it doesn’t ta |
12 Best Clean Energy Stocks To Buy According to BillionairesIn this piece, we will take a look at the 12 best clean energy stocks to buy according to billionaires. If you want to skip our overview of the clean energy industry and some recent news, then you can skip and read 5 Best Clean Energy Stocks To Buy According to Billionaires. Alongside biotechnology and […] |
Insider Buying: President and CEO Todd Becker Acquires Shares of Green Plains IncInsider buying can often provide valuable insights into a company's prospects and the confidence that management has in the future of the business. |
Hedge Funds are Betting on These 14 Sliding StocksIn this article, we will take a look at the hedge funds that are betting on these 14 sliding stocks. To see more such companies, go directly to Hedge Funds are Betting on These 5 Sliding Stocks. Stocks jumped on December 6 after the release of yet another welcome data point for the Federal Reserve, […] |
GPP Price Returns
| 1-mo | N/A |
| 3-mo | N/A |
| 6-mo | N/A |
| 1-year | -9.22% |
| 3-year | 25.55% |
| 5-year | 37.36% |
| YTD | -3.30% |
| 2023 | 12.22% |
| 2022 | 3.68% |
| 2021 | 89.53% |
| 2020 | -37.31% |
| 2019 | 15.88% |
GPP Dividends
| Ex-Dividend Date | Type | Payout Amount | Change | ||||||
|---|---|---|---|---|---|---|---|---|---|
| Loading, please wait... | |||||||||
Continue Researching GPP
Want to see what other sources are saying about Green Plains Partners LP's financials and stock price? Try the links below:Green Plains Partners LP (GPP) Stock Price | Nasdaq
Green Plains Partners LP (GPP) Stock Quote, History and News - Yahoo Finance
Green Plains Partners LP (GPP) Stock Price and Basic Information | MarketWatch
Loading social stream, please wait...