
Gap Inc. (GPS): Price and Financial Metrics
GPS Price/Volume Stats
| Current price | $21.44 | 52-week high | $30.75 |
| Prev. close | $21.11 | 52-week low | $9.38 |
| Day low | $21.04 | Volume | 5,715,538 |
| Day high | $21.47 | Avg. volume | 7,758,759 |
| 50-day MA | $23.71 | Dividend yield | 2.72% |
| 200-day MA | $20.70 | Market Cap | 8.04B |
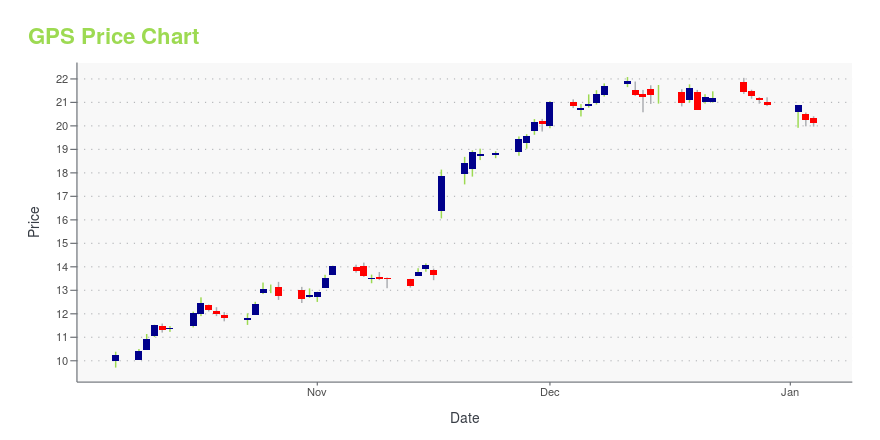
GPS Stock Price Chart Interactive Chart >
Gap Inc. (GPS) Company Bio
The Gap, Inc., commonly known as Gap Inc. or Gap (stylized asGAP), is an American worldwide clothing and accessories retailer. Gap was founded in 1969 by Donald Fisher and Doris F. Fisher and is headquartered in San Francisco, California. The company operates four primary divisions: Gap (the namesake banner), Banana Republic, Old Navy, and Athleta. Gap Inc. is the largest specialty retailer in the United States, and is 3rd in total international locations, behind Inditex Group and H&M. As of September 2008, the company has approximately 135,000 employees and operates 3,727 stores worldwide, of which 2,406 are located in the U.S. (Source:Wikipedia)
Latest GPS News From Around the Web
Below are the latest news stories about GAP INC that investors may wish to consider to help them evaluate GPS as an investment opportunity.
Tech Stalls As Rising Bond Yields Spook InvestorsIt's been an inauspicious start to the 2024 trading year, with all three major indexes in the red midday. |
Casey's (CASY) Growth Initiatives Position It Well for 2024Casey's (CASY) leverages technology, analytics and growth initiatives in product optimization and cost efficiency to enhance customer engagement, supporting robust growth and market presence. |
Stitch Fix (SFIX) is Poised on Operational Excellence & GrowthStitch Fix's (SFIX) focus on efficiency, client satisfaction and advanced technologies position it for success despite challenges in active client retention. |
Walmart (WMT) Looks Poised to Continue Its Growth Story in 2024Walmart (WMT) is poised to keep its growth story going with its robust store and online operations. Gains from higher-margin ventures, such as advertising, are also noteworthy. |
Deckers (DECK) Thrives on Brand Expansion & Strong MarketingDeckers' (DECK) brand expansion initiatives, robust DTC business and customer-focused strategies have propelled its growth in the competitive footwear market. |
GPS Price Returns
| 1-mo | -11.74% |
| 3-mo | 1.07% |
| 6-mo | 10.02% |
| 1-year | 119.21% |
| 3-year | -15.93% |
| 5-year | 30.92% |
| YTD | 4.61% |
| 2023 | 96.66% |
| 2022 | -32.64% |
| 2021 | -11.11% |
| 2020 | 15.74% |
| 2019 | -28.10% |
GPS Dividends
| Ex-Dividend Date | Type | Payout Amount | Change | ||||||
|---|---|---|---|---|---|---|---|---|---|
| Loading, please wait... | |||||||||
Continue Researching GPS
Want to see what other sources are saying about Gap Inc's financials and stock price? Try the links below:Gap Inc (GPS) Stock Price | Nasdaq
Gap Inc (GPS) Stock Quote, History and News - Yahoo Finance
Gap Inc (GPS) Stock Price and Basic Information | MarketWatch
Loading social stream, please wait...