
U.S. Global Investors, Inc. - (GROW): Price and Financial Metrics
GROW Price/Volume Stats
| Current price | $2.65 | 52-week high | $3.26 |
| Prev. close | $2.63 | 52-week low | $2.47 |
| Day low | $2.64 | Volume | 22,620 |
| Day high | $2.67 | Avg. volume | 29,666 |
| 50-day MA | $2.62 | Dividend yield | 3.35% |
| 200-day MA | $2.73 | Market Cap | 36.87M |
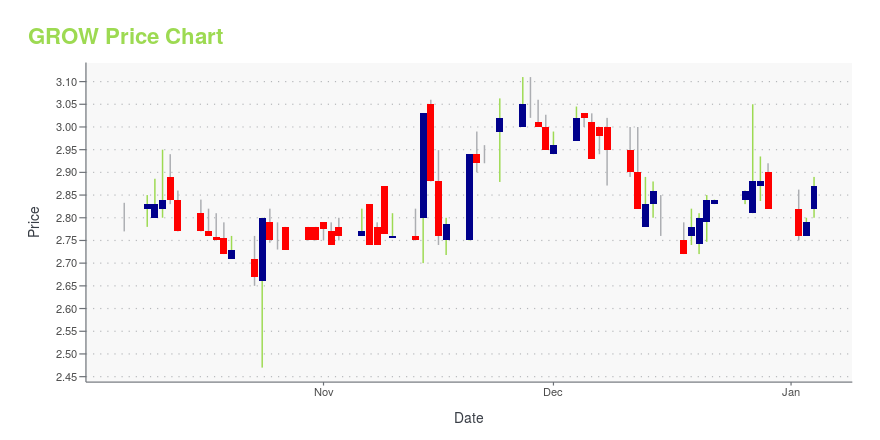
GROW Stock Price Chart Interactive Chart >
Latest GROW News From Around the Web
Below are the latest news stories about U S GLOBAL INVESTORS INC that investors may wish to consider to help them evaluate GROW as an investment opportunity.
U.S. Global Investors Announces Continuation of Monthly GROW Dividends, Provides Update on GoldGold Price on an Upward Trajectory as Treasury Yields Fell Below Key Moving Average U.S. Global Investors San Antonio, TX, Dec. 19, 2023 (GLOBE NEWSWIRE) -- U.S. Global Investors, Inc. (NASDAQ: GROW), a registered investment advisory firm with longstanding experience in global markets and specialized sectors, is pleased to announce that it will continue its payment of monthly dividends. The Company’s Board of Directors (the “Board”) approved payment of the $0.0075 per share per month dividend be |
GROW Stock Earnings: US Global Investors Reported Results for Q1 2024US Global Investors just reported results for the first quarter of 2024. |
U.S. Global Investors Reports Financial Results for the First Quarter of 2024 Fiscal YearSAN ANTONIO, Dec. 14, 2023 (GLOBE NEWSWIRE) -- U.S. Global Investors, Inc. (NASDAQ: GROW) (the “Company”), a registered investment advisory firm with longstanding experience in global markets and specialized sectors from gold mining to airlines, today reported operating income of $215,000 for the quarter ended September 30, 2023, on total revenues of $3.1 million. The Company recorded a net loss of $176,000, or $0.01 per share. Average assets under management (AUM) for the three-month period end |
U.S. Global Investors Launches Gold Royalty GOAU ETF on Peru’s Lima Stock Exchange, Provides Update on Share Buyback ProgramSan Antonio, TX, Dec. 06, 2023 (GLOBE NEWSWIRE) -- U.S. Global Investors, Inc. (NASDAQ: GROW) (the “Company”), a registered investment advisory firm with longstanding experience in global markets and specialized sectors, today is pleased to announce that its gold mining and royalty ETF, the U.S. Global GO GOLD and Precious Metal Miners ETF (NYSE: GOAU), is now listed on Peru’s Bolsa de Valores de Lima (Lima Stock Exchange). The new listing expands GOAU’s global footprint and provides Peruvian in |
U.S. Global Investors Shares Optimism for Airline and Gold Sectors into Year-End, Receives Expected Nasdaq Notice Regarding Late Filing of Form 10-QSan Antonio, TX, Nov. 22, 2023 (GLOBE NEWSWIRE) -- U.S. Global Investors, Inc. (NASDAQ: GROW) (the “Company”), a registered investment advisory firm with longstanding experience in global markets and specialized sectors, today shares its positive outlook for two primary sectors of its investment offerings, airlines and gold, as shareholders head into year-end. The American Automobile Association (AAA) projects a significant increase in Thanksgiving travel this year with 55.4 million travelers ex |
GROW Price Returns
| 1-mo | 2.98% |
| 3-mo | -0.70% |
| 6-mo | -5.22% |
| 1-year | -13.31% |
| 3-year | -49.85% |
| 5-year | 69.16% |
| YTD | -4.31% |
| 2023 | 0.47% |
| 2022 | -32.78% |
| 2021 | -18.44% |
| 2020 | 283.38% |
| 2019 | 33.16% |
GROW Dividends
| Ex-Dividend Date | Type | Payout Amount | Change | ||||||
|---|---|---|---|---|---|---|---|---|---|
| Loading, please wait... | |||||||||
Continue Researching GROW
Want to do more research on U S Global Investors Inc's stock and its price? Try the links below:U S Global Investors Inc (GROW) Stock Price | Nasdaq
U S Global Investors Inc (GROW) Stock Quote, History and News - Yahoo Finance
U S Global Investors Inc (GROW) Stock Price and Basic Information | MarketWatch
Loading social stream, please wait...