
Granite REIT Inc. (GRP.U): Price and Financial Metrics
GRP.U Price/Volume Stats
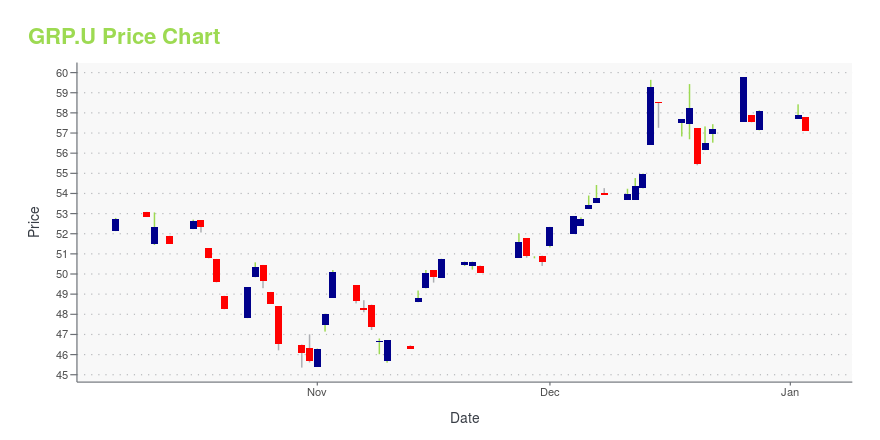
| Current price | $53.31 | 52-week high | $59.82 |
| Prev. close | $54.24 | 52-week low | $45.35 |
| Day low | $53.11 | Volume | 7,700 |
| Day high | $53.37 | Avg. volume | 15,412 |
| 50-day MA | $50.85 | Dividend yield | 4.17% |
| 200-day MA | $52.87 | Market Cap | 3.34B |
GRP.U Stock Price Chart Interactive Chart >
Granite REIT Inc. (GRP.U) Company Bio
Granite is a Canadian-based REIT engaged in the acquisition, development, ownership and management of logistics, warehouse and industrial properties in North America and Europe. Granite owns 108 investment properties representing approximately 45.3 million square feet of leasable area.
Latest GRP.U News From Around the Web
Below are the latest news stories about GRANITE REAL ESTATE INVESTMENT TRUST that investors may wish to consider to help them evaluate GRP.U as an investment opportunity.
Granite Real Estate Investment declares CAD 0.2583 dividend
|
GRP.U Price Returns
| 1-mo | 9.64% |
| 3-mo | 6.55% |
| 6-mo | 0.11% |
| 1-year | -6.00% |
| 3-year | N/A |
| 5-year | 33.59% |
| YTD | -5.52% |
| 2023 | 17.60% |
| 2022 | -36.66% |
| 2021 | 37.94% |
| 2020 | 25.55% |
| 2019 | 36.22% |
GRP.U Dividends
| Ex-Dividend Date | Type | Payout Amount | Change | ||||||
|---|---|---|---|---|---|---|---|---|---|
| Loading, please wait... | |||||||||
Loading social stream, please wait...