
GSI Technology, Inc. (GSIT): Price and Financial Metrics
GSIT Price/Volume Stats
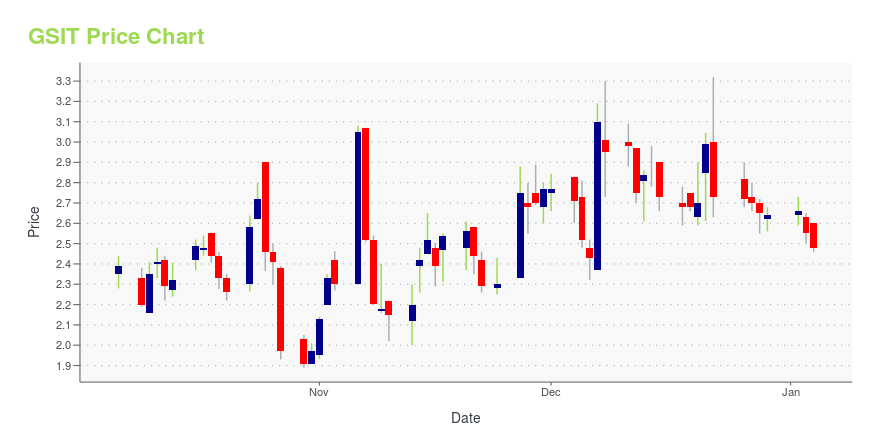
| Current price | $2.85 | 52-week high | $6.02 |
| Prev. close | $2.84 | 52-week low | $1.88 |
| Day low | $2.77 | Volume | 123,715 |
| Day high | $2.94 | Avg. volume | 362,306 |
| 50-day MA | $2.76 | Dividend yield | N/A |
| 200-day MA | $2.90 | Market Cap | 72.52M |
GSIT Stock Price Chart Interactive Chart >
GSI Technology, Inc. (GSIT) Company Bio
GSI Technology, Inc., a fabless semiconductor company, designs, develops, and markets memory products primarily for the networking and telecommunications markets in the United States, China, Malaysia, Singapore, and internationally. The company was founded in 1995 and is based in Sunnyvale, California.
Latest GSIT News From Around the Web
Below are the latest news stories about GSI TECHNOLOGY INC that investors may wish to consider to help them evaluate GSIT as an investment opportunity.
GSI Technology to Participate in the iAccess Alpha Tax Loss Recovery Summit 2024 - Buyside Best Ideas Virtual Conference on January 9 and 10, 2024SUNNYVALE, Calif., Dec. 19, 2023 (GLOBE NEWSWIRE) -- GSI Technology, Inc. (Nasdaq: GSIT), developer of the Gemini® Associative Processing Unit (APU) for AI and high-performance parallel computing (HPPC) and a leading provider of high-performance memory solutions for the networking, telecommunications, and military markets, today announced that management is participating in the iAccess Alpha Tax Loss Recovery Summit Virtual Conference on January 9 and 10, 2024. On behalf of the company Didier La |
Will GSI Technology (NASDAQ:GSIT) Spend Its Cash Wisely?We can readily understand why investors are attracted to unprofitable companies. For example, although Amazon.com made... |
GSI Technology to Participate Virtually in the 26th Annual Needham Growth Conference on January 19, 2024SUNNYVALE, Calif., Dec. 04, 2023 (GLOBE NEWSWIRE) -- GSI Technology, Inc. (Nasdaq: GSIT), developer of the Gemini® Associative Processing Unit (APU) for AI and high-performance parallel computing (HPPC) and a leading provider of high-performance memory solutions for the networking, telecommunications, and military markets, today announced that that management is scheduled to virtually participate in the 26th Annual Needham Growth Conference on January 19, 2024. On behalf of the company, Lee-Lean |
GSI Technology Teams Up with UC Riverside to Supercharge AI and High Performance Computing with Gemini APUSUNNYVALE, Calif., Nov. 29, 2023 (GLOBE NEWSWIRE) -- GSI Technology, Inc. (Nasdaq: GSIT), developer of the Gemini® Associative Processing Unit (APU) for AI and high-performance computing (HPC) and a leading provider of high-performance memory solutions for the networking, telecommunications, and military markets, today announced a collaboration with Professor Elaheh Sadredini of the Computer Science Department at the University of California, Riverside. Utilizing the Gemini APU, Professor Sadred |
GSI Technology, Inc. (NASDAQ:GSIT) Q2 2024 Earnings Call TranscriptGSI Technology, Inc. (NASDAQ:GSIT) Q2 2024 Earnings Call Transcript October 26, 2023 Operator: Ladies and gentlemen, thank you for standing by. Welcome to GSI Technology’s Second Quarter Fiscal 2024 Results Conference Call. [Operator Instructions] Before we begin today’s call, the company has requested that I read the following safe harbor statement. The matters discussed in […] |
GSIT Price Returns
| 1-mo | 11.33% |
| 3-mo | -24.80% |
| 6-mo | 51.60% |
| 1-year | -42.54% |
| 3-year | -45.19% |
| 5-year | -65.83% |
| YTD | 7.95% |
| 2023 | 52.60% |
| 2022 | -62.63% |
| 2021 | -37.43% |
| 2020 | 4.37% |
| 2019 | 37.94% |
Continue Researching GSIT
Want to do more research on Gsi Technology Inc's stock and its price? Try the links below:Gsi Technology Inc (GSIT) Stock Price | Nasdaq
Gsi Technology Inc (GSIT) Stock Quote, History and News - Yahoo Finance
Gsi Technology Inc (GSIT) Stock Price and Basic Information | MarketWatch
Loading social stream, please wait...