
Gran Tierra Energy Inc. (GTE): Price and Financial Metrics
GTE Price/Volume Stats
| Current price | $9.29 | 52-week high | $10.40 |
| Prev. close | $9.29 | 52-week low | $4.72 |
| Day low | $9.16 | Volume | 188,094 |
| Day high | $9.34 | Avg. volume | 357,466 |
| 50-day MA | $9.57 | Dividend yield | N/A |
| 200-day MA | $7.21 | Market Cap | 291.07M |
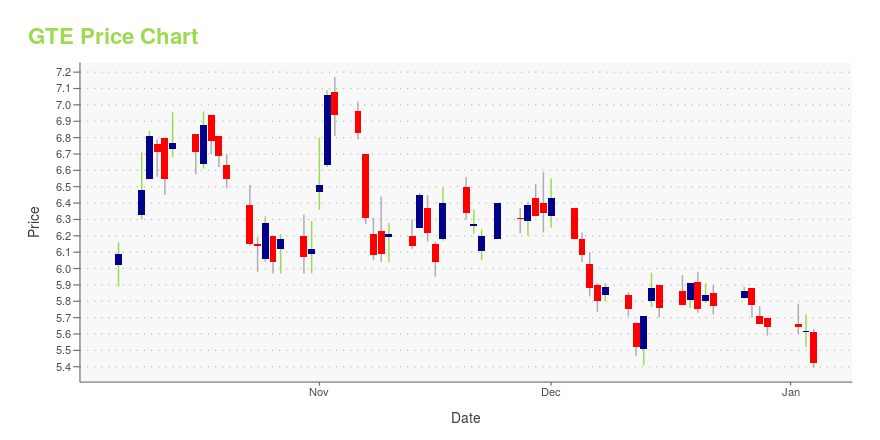
GTE Stock Price Chart Interactive Chart >
Gran Tierra Energy Inc. (GTE) Company Bio
Gran Tierra Energy Inc. engages in the acquisition, exploration, development, and production of oil and gas properties in Colombia, Peru, and Brazil. The company was founded in 2003 and is based in Calgary, Canada.
Latest GTE News From Around the Web
Below are the latest news stories about GRAN TIERRA ENERGY INC that investors may wish to consider to help them evaluate GTE as an investment opportunity.
Gran Tierra Energy Inc. (AMEX:GTE) Q3 2023 Earnings Call TranscriptGran Tierra Energy Inc. (AMEX:GTE) Q3 2023 Earnings Call Transcript November 1, 2023 Operator: Good morning, ladies and gentlemen, and welcome to Gran Tierra Energy’s Results Conference Call for the Third Quarter 2023. My name is Shannon and I will be your coordinator for today. At this time, all participants are in a listen-only mode. […] |
Gran Tierra Energy Inc. Announces Normal Course Issuer Bid and Automatic Share Purchase PlanCALGARY, Alberta, Oct. 31, 2023 (GLOBE NEWSWIRE) -- Gran Tierra Energy Inc. (“Gran Tierra”) (NYSE American: GTE)(TSX: GTE)(LSE: GTE), today announces that the Toronto Stock Exchange (“TSX”) has approved its notice of intention to make a normal course issuer bid (the “Bid”) for its shares of common stock (the “Shares”). As of October 20, 2023, there were 33,288,305 Shares issued and outstanding and the public float was 32,349,140 Shares. Pursuant to the Bid, Gran Tierra will be able to purchase f |
Gran Tierra Energy Inc. Announces Third Quarter 2023 Results Including the Highest Production Since the Second Quarter of 2019, Net Income of $7 Million and $36 Million of Free Cash FlowThird Quarter 2023 Total Average WI Production of 33,940 BOPD, Up 12% from One Year Ago and Up 1% from Prior Quarter, Highest Quarterly Average Since Second Quarter 2019 Third Quarter 2023 Net Income of $7 Million, Funds Flow from Operations of $79 Million and Free Cash Flow of $36 Million Third Quarter 2023 Adjusted EBITDA of $119 Million and 12-Month Trailing Adjusted EBITDA of $413 MillionSubsequent to Third Quarter 2023, Issuance of New 9.500% Senior Secured Amortizing Notes Due 2029 in Exch |
Gran Tierra Energy Inc. Announces Appointment of Chief Operating OfficerCALGARY, Alberta, Oct. 31, 2023 (GLOBE NEWSWIRE) -- Gran Tierra Energy Inc. ("Gran Tierra" or the "Company") (NYSE American:GTE)(TSX:GTE)(LSE:GTE) is pleased to announce the appointment of Mr. Sebastien Morin as Chief Operating Officer (“COO”). Mr. Morin will be joining Gran Tierra as COO, located in Calgary and will report to Gary Guidry, President and Chief Executive Officer. Mr. Morin was most recently President & COO at WesternZagros Resources Ltd., a privately-owned petroleum operating comp |
Gran Tierra Energy Inc. Provides Release Date for its 2023 Third Quarter Results and Details of Conference Call and WebcastCALGARY, Alberta, Oct. 24, 2023 (GLOBE NEWSWIRE) -- Gran Tierra Energy Inc. (“Gran Tierra” or the “Company”) (NYSE American:GTE) (TSX:GTE) (LSE:GTE) announces that the Company will release its 2023 third quarter financial and operating results on Tuesday, October 31, 2023, after market close. Gran Tierra will host its 2023 third quarter results conference call on Wednesday, November 1, 2023, at 9:00 a.m. Mountain Time, 11:00 a.m. Eastern Time. Interested parties may register for the conference c |
GTE Price Returns
| 1-mo | -8.83% |
| 3-mo | 10.99% |
| 6-mo | 72.04% |
| 1-year | 38.86% |
| 3-year | 53.33% |
| 5-year | -41.94% |
| YTD | 64.72% |
| 2023 | -43.03% |
| 2022 | 30.07% |
| 2021 | 109.21% |
| 2020 | -71.80% |
| 2019 | -40.55% |
Continue Researching GTE
Want to do more research on Gran Tierra Energy Inc's stock and its price? Try the links below:Gran Tierra Energy Inc (GTE) Stock Price | Nasdaq
Gran Tierra Energy Inc (GTE) Stock Quote, History and News - Yahoo Finance
Gran Tierra Energy Inc (GTE) Stock Price and Basic Information | MarketWatch
Loading social stream, please wait...