G1 Therapeutics, Inc. (GTHX): Price and Financial Metrics
GTHX Price/Volume Stats
Current price | $4.32 | 52-week high | $5.00 |
Prev. close | $4.47 | 52-week low | $1.08 |
Day low | $4.30 | Volume | 956,500 |
Day high | $4.66 | Avg. volume | 1,473,131 |
50-day MA | $3.54 | Dividend yield | N/A |
200-day MA | $2.44 | Market Cap | 225.50M |
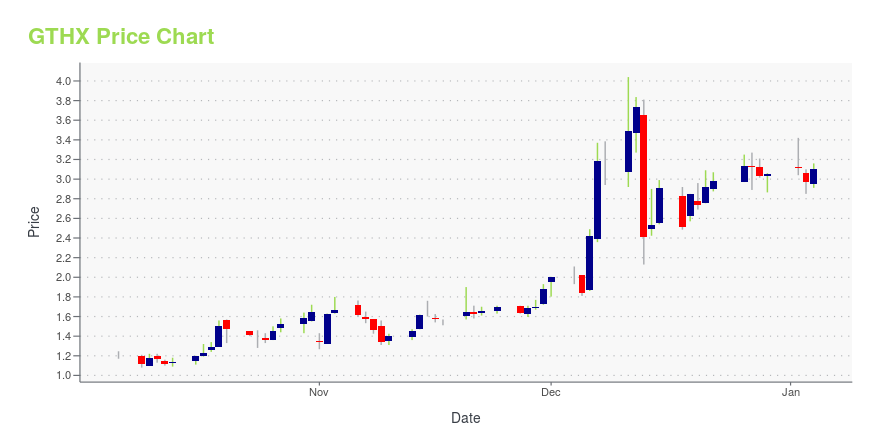
GTHX Stock Price Chart Interactive Chart >
GTHX POWR Grades
- GTHX scores best on the Value dimension, with a Value rank ahead of 82.79% of US stocks.
- The strongest trend for GTHX is in Growth, which has been heading down over the past 26 weeks.
- GTHX's current lowest rank is in the Stability metric (where it is better than 0.93% of US stocks).
GTHX Stock Summary
- With a year-over-year growth in debt of -32.19%, G1 THERAPEUTICS INC's debt growth rate surpasses merely 10% of about US stocks.
- As for revenue growth, note that GTHX's revenue has grown 66.26% over the past 12 months; that beats the revenue growth of 93.2% of US companies in our set.
- In terms of volatility of its share price, GTHX is more volatile than 84.26% of stocks we're observing.
- Stocks that are quantitatively similar to GTHX, based on their financial statements, market capitalization, and price volatility, are MRIN, PDEX, GPRO, WISA, and HYPR.
- GTHX's SEC filings can be seen here. And to visit G1 THERAPEUTICS INC's official web site, go to www.g1therapeutics.com.
GTHX Valuation Summary
- GTHX's price/earnings ratio is -2.2; this is 107.55% lower than that of the median Healthcare stock.
- Over the past 81 months, GTHX's price/sales ratio has gone NA NA.
Below are key valuation metrics over time for GTHX.
Stock | Date | P/S | P/B | P/E | EV/EBIT |
---|---|---|---|---|---|
GTHX | 2023-12-29 | 2.0 | 3.7 | -2.2 | -2.8 |
GTHX | 2023-12-28 | 2.0 | 3.7 | -2.2 | -2.8 |
GTHX | 2023-12-27 | 2.1 | 3.8 | -2.3 | -2.9 |
GTHX | 2023-12-26 | 2.1 | 3.8 | -2.3 | -2.9 |
GTHX | 2023-12-22 | 2.0 | 3.6 | -2.2 | -2.8 |
GTHX | 2023-12-21 | 1.9 | 3.5 | -2.1 | -2.7 |
GTHX's Quality Factors
The “Quality” component of the POWR Ratings focuses on 31 different factors of a companies fundamentals and operational strength. Here are some key insights as we drill into the specifics of these quality attributes.- GTHX has a Quality Grade of D, ranking ahead of 22.6% of graded US stocks.
- GTHX's asset turnover comes in at 0.239 -- ranking 181st of 681 Pharmaceutical Products stocks.
- NVAX, SRRA, and OCX are the stocks whose asset turnover ratios are most correlated with GTHX.
The table below shows GTHX's key quality metrics over time.
Period | Asset Turnover | Gross Margin | ROIC |
---|---|---|---|
2021-06-30 | 0.239 | 0.984 | -3.150 |
2021-03-31 | 0.219 | 0.996 | -3.451 |
2020-12-31 | 0.182 | 1.000 | -5.667 |
2020-09-30 | 0.101 | 1.000 | -9.018 |
2020-06-30 | 0.000 | NA | -13.386 |
2020-03-31 | 0.000 | NA | -148.700 |
GTHX Price Target
For more insight on analysts targets of GTHX, see our GTHX price target page. And for a list of of all stocks sorted by upside potential based on analyst target price, see our Top Price Target page.
Average Price Target | $50.86 | Average Broker Recommendation | 1.44 (Moderate Buy) |
G1 Therapeutics, Inc. (GTHX) Company Bio
G1 Therapeutics, Inc., a clinical-stage biopharmaceutical company, focuses on the discovery and development of novel therapeutics for the treatment of cancer in the United States. The company was founded in 2008 and is based in Research Triangle Park, North Carolina.
Latest GTHX News From Around the Web
Below are the latest news stories about G1 THERAPEUTICS INC that investors may wish to consider to help them evaluate GTHX as an investment opportunity.
Insider Sell Alert: Chief Medical Officer Rajesh Malik Offloads Shares of G1 Therapeutics IncIn a notable insider transaction, Chief Medical Officer Rajesh Malik has sold a significant number of shares in G1 Therapeutics Inc (NASDAQ:GTHX), a clinical-stage biopharmaceutical company. |
G1 Therapeutics (NASDAQ:GTHX) adds US$67m to market cap in the past 7 days, though investors from five years ago are still down 90%This month, we saw the G1 Therapeutics, Inc. ( NASDAQ:GTHX ) up an impressive 103%. But will that heal all the wounds... |
G1 Therapeutics Presents New Post Hoc Analyses Indicating That Patients Who Previously Received Trilaciclib Have Improved Overall Survival with Subsequent Anticancer Therapy- Analyses of Data from the Randomized Phase 2 Metastatic Triple Negative Breast Cancer (mTNBC) Trial Indicate That Prior Use of Trilaciclib with Cytotoxic Chemotherapy is Highly Correlated to Improved Long-Term Survival with Subsequent Anticancer Therapies - - Improved Long-Term Survival Also Observed in Patients Who Received Prior Trilaciclib with Cytotoxic Therapy and Were Unable to Receive Subsequent Anticancer Therapy - - Data Presented at the 2023 San Antonio Breast Cancer Symposium (SABCS |
G1 Therapeutics Announces Inducement Grants Under Nasdaq Listing Rule 5635(c)(4)RESEARCH TRIANGLE PARK, N.C., Dec. 01, 2023 (GLOBE NEWSWIRE) -- G1 Therapeutics, Inc. (Nasdaq: GTHX), a commercial-stage oncology company, today announced the grant of inducement stock options exercisable for 4,700 shares of G1’s common stock and 2,300 restricted stock units (RSUs) to one hired employee under the Amended and Restated G1 Therapeutics, Inc. 2021 Inducement Equity Incentive Plan (the “Amended and Restated 2021 Plan”). These equity awards were granted as an inducement material to th |
G1 Therapeutics Announces Upcoming Presentation at the 2023 San Antonio Breast Cancer SymposiumRESEARCH TRIANGLE PARK, N.C., Nov. 29, 2023 (GLOBE NEWSWIRE) -- G1 Therapeutics, Inc. (Nasdaq: GTHX), a commercial-stage oncology company, today announced that an abstract exploring the long-term impact of trilaciclib on survival outcomes in patients with metastatic triple negative breast cancer (mTNBC) from the Company’s Phase 2 trial (NCT02978716) will be presented in a poster session during the upcoming 2023 San Antonio Breast Cancer Symposium (SABCS), held December 5th through 9th in San Ant |
GTHX Price Returns
1-mo | 29.73% |
3-mo | 41.64% |
6-mo | 200.00% |
1-year | 67.44% |
3-year | -81.21% |
5-year | -73.98% |
YTD | 41.64% |
2023 | -43.83% |
2022 | -46.82% |
2021 | -43.25% |
2020 | -31.93% |
2019 | 38.02% |
Loading social stream, please wait...