
Good Times Restaurants Inc. (GTIM): Price and Financial Metrics
GTIM Price/Volume Stats
| Current price | $1.79 | 52-week high | $3.45 |
| Prev. close | $1.73 | 52-week low | $1.51 |
| Day low | $1.74 | Volume | 11,800 |
| Day high | $1.81 | Avg. volume | 15,754 |
| 50-day MA | $1.78 | Dividend yield | N/A |
| 200-day MA | $2.41 | Market Cap | 19.05M |
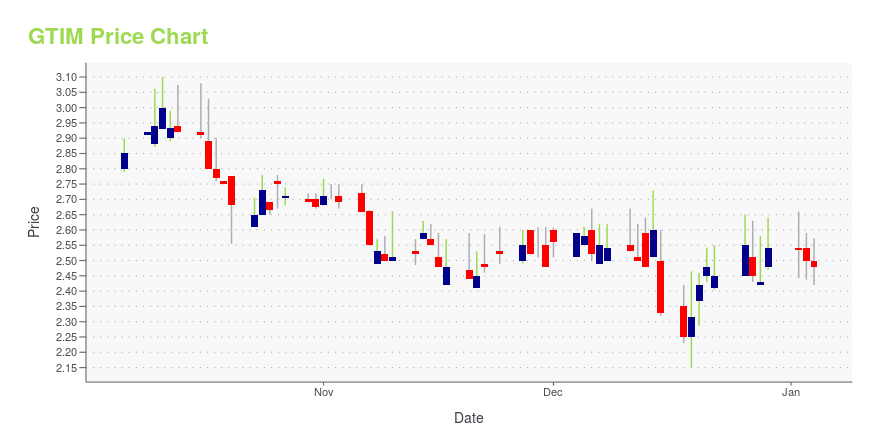
GTIM Stock Price Chart Interactive Chart >
GTIM Price Returns
| 1-mo | 16.23% |
| 3-mo | -24.47% |
| 6-mo | N/A |
| 1-year | -32.96% |
| 3-year | -39.93% |
| 5-year | 58.41% |
| YTD | -30.89% |
| 2024 | 1.97% |
| 2023 | 13.39% |
| 2022 | -48.39% |
| 2021 | 52.28% |
| 2020 | 79.25% |
Continue Researching GTIM
Here are a few links from around the web to help you further your research on Good Times Restaurants Inc's stock as an investment opportunity:Good Times Restaurants Inc (GTIM) Stock Price | Nasdaq
Good Times Restaurants Inc (GTIM) Stock Quote, History and News - Yahoo Finance
Good Times Restaurants Inc (GTIM) Stock Price and Basic Information | MarketWatch
Loading social stream, please wait...