
Good Times Restaurants Inc. (GTIM): Price and Financial Metrics
GTIM Price/Volume Stats
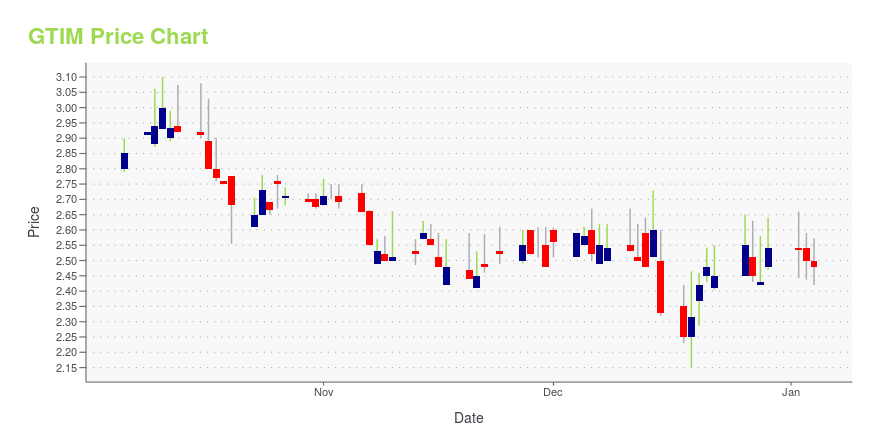
| Current price | $2.60 | 52-week high | $3.35 |
| Prev. close | $2.59 | 52-week low | $2.15 |
| Day low | $2.60 | Volume | 7,203 |
| Day high | $2.61 | Avg. volume | 18,721 |
| 50-day MA | $2.57 | Dividend yield | N/A |
| 200-day MA | $2.56 | Market Cap | 28.61M |
GTIM Stock Price Chart Interactive Chart >
Latest GTIM News From Around the Web
Below are the latest news stories about GOOD TIMES RESTAURANTS INC that investors may wish to consider to help them evaluate GTIM as an investment opportunity.
Good Times Restaurants Inc. (NASDAQ:GTIM) Q4 2023 Earnings Call TranscriptGood Times Restaurants Inc. (NASDAQ:GTIM) Q4 2023 Earnings Call Transcript December 14, 2023 Operator: Good afternoon, ladies and gentlemen. Welcome to the Good Times Restaurants Incorporated Fiscal 2023 Fourth Quarter and Year-End Earnings Call. By now, everyone should have access to the company’s earnings release, which is available in the Investors section of the company’s […] |
Estimating The Intrinsic Value Of Good Times Restaurants Inc. (NASDAQ:GTIM)Key Insights Using the 2 Stage Free Cash Flow to Equity, Good Times Restaurants fair value estimate is US$2.50 Good... |
GTIM Stock Earnings: Good Times Restaurants Reported Results for Q4 2023Good Times Restaurants just reported results for the fourth quarter of 2023. |
Q4 2023 Good Times Restaurants Inc Earnings CallQ4 2023 Good Times Restaurants Inc Earnings Call |
Good Times Restaurants Inc. (GTIM) Q4 2023 Earnings Call TranscriptGood Times Restaurants Inc. (GTIM) Q4 2023 Earnings Conference Call December 14, 2023 5:00 PM ET Company Participants Ryan Zink - President and Chief Executive Officer Conference Call Participants Brian London - Individual Investor Presentation Operator Good afternoon, ladies and gentlemen. Welcome to the Good Times Restaurants Incorporated Fiscal 2023 Fourth Quarter and Year-End Earnings Call. By now, everyone should have access to the company's earnings release, which is available in the Investors section of the company's website. As a reminder, a part of today's discussion will include forward-looking statements within the meaning of Federal Securities La... |
GTIM Price Returns
| 1-mo | 0.39% |
| 3-mo | -6.81% |
| 6-mo | 2.77% |
| 1-year | -19.75% |
| 3-year | -43.60% |
| 5-year | 36.13% |
| YTD | 2.36% |
| 2023 | 13.39% |
| 2022 | -48.39% |
| 2021 | 52.28% |
| 2020 | 79.25% |
| 2019 | -36.40% |
Continue Researching GTIM
Here are a few links from around the web to help you further your research on Good Times Restaurants Inc's stock as an investment opportunity:Good Times Restaurants Inc (GTIM) Stock Price | Nasdaq
Good Times Restaurants Inc (GTIM) Stock Quote, History and News - Yahoo Finance
Good Times Restaurants Inc (GTIM) Stock Price and Basic Information | MarketWatch
Loading social stream, please wait...