
Gulf Resources, Inc. (GURE): Price and Financial Metrics
GURE Price/Volume Stats
| Current price | $0.62 | 52-week high | $1.47 |
| Prev. close | $0.62 | 52-week low | $0.50 |
| Day low | $0.60 | Volume | 25,400 |
| Day high | $0.63 | Avg. volume | 462,427 |
| 50-day MA | $0.67 | Dividend yield | N/A |
| 200-day MA | $0.00 | Market Cap | 8.28M |
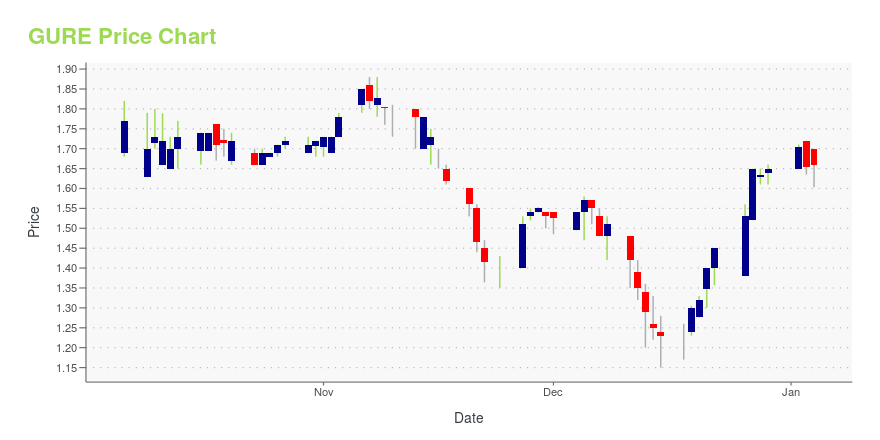
GURE Stock Price Chart Interactive Chart >
GURE Price Returns
| 1-mo | -14.48% |
| 3-mo | -4.17% |
| 6-mo | -19.48% |
| 1-year | -41.23% |
| 3-year | -86.07% |
| 5-year | -89.75% |
| YTD | 9.25% |
| 2024 | -65.61% |
| 2023 | -46.60% |
| 2022 | -28.64% |
| 2021 | 5.10% |
| 2020 | 61.54% |
Continue Researching GURE
Want to do more research on Gulf Resources Inc's stock and its price? Try the links below:Gulf Resources Inc (GURE) Stock Price | Nasdaq
Gulf Resources Inc (GURE) Stock Quote, History and News - Yahoo Finance
Gulf Resources Inc (GURE) Stock Price and Basic Information | MarketWatch
Loading social stream, please wait...