
Gulf Resources, Inc. (GURE): Price and Financial Metrics
GURE Price/Volume Stats
| Current price | $1.09 | 52-week high | $2.43 |
| Prev. close | $1.08 | 52-week low | $0.85 |
| Day low | $1.07 | Volume | 1,800 |
| Day high | $1.10 | Avg. volume | 57,041 |
| 50-day MA | $1.35 | Dividend yield | N/A |
| 200-day MA | $1.44 | Market Cap | 11.37M |
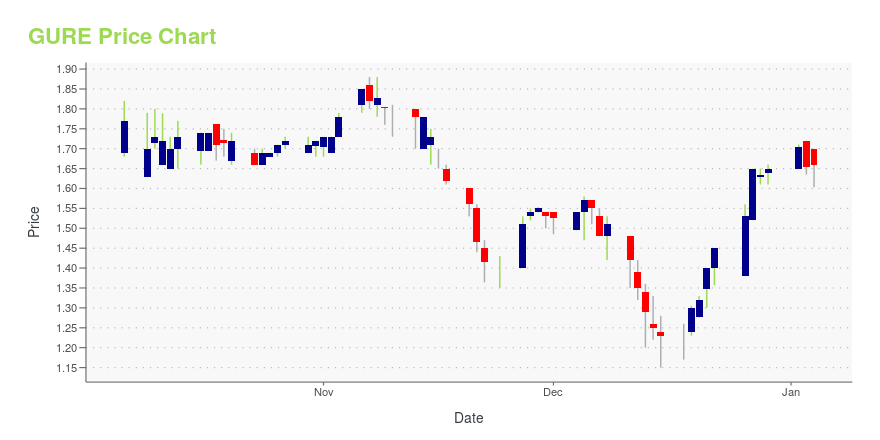
GURE Stock Price Chart Interactive Chart >
Latest GURE News From Around the Web
Below are the latest news stories about GULF RESOURCES INC that investors may wish to consider to help them evaluate GURE as an investment opportunity.
Gulf Resources, Inc. (NASDAQ:GURE) Q3 2023 Earnings Call TranscriptGulf Resources, Inc. (NASDAQ:GURE) Q3 2023 Earnings Call Transcript November 21, 2023 Operator: Greetings. Welcome to the Gulf Resources Third Quarter 2023 Earnings Conference. [Operator Instructions]. Please note, this conference is being recorded. I will now turn the conference over to your host, Helen Xu. You may begin. Helen Xu: Thank you, operator. Good morning, […] |
Gulf Resources Reports Unaudited Financial Results for Three and Nine Months Ended September 30,2023SHOUGUANG, China, Nov. 20, 2023 (GLOBE NEWSWIRE) -- Gulf Resources (NASDAQ:GURE) a leading manufacturer of bromine, crude salt and specialty chemical products in China, today announced its financial results for the three and nine months ended September 30, 2023. In the third quarter, sales declined by 74%.Net income after tax was a loss of $1,775,797 compared to a profit of $8,967,380.Net loss per share was ($0.17*) compared to a net profit of $0.86*.Ending cash was $103,774,977 or $9.95* per sh |
Gulf Resources Announces Conference Call to Discuss its Third Quarter 2023 ResultsSHOUGUANG, China, Nov. 20, 2023 (GLOBE NEWSWIRE) -- Gulf Resources, Inc. (Nasdaq:GURE) ("Gulf Resources" or the "Company"), a leading manufacturer of bromine, crude salt and specialty chemical products in China, today announced that the Company will host a conference call on Monday, November 20, 2023 at 07:30 PM Eastern Time to discuss its Third Quarter 2023 results ended September 30, 2023. Mr. Xiaobin Liu, CEO of Gulf Resources, will be hosting the call. The Company management team will be ava |
Gulf Resources Announces Its Flood Prevention PlanSHOUGUANG, China, Nov. 17, 2023 (GLOBE NEWSWIRE) -- Gulf Resources, Inc. (Nasdaq:GURE) ("Gulf Resources" or the "Company"), a leading manufacturer of bromine, crude salt and specialty chemical products in China, today announced that it has recently initiated its preventive measures for safeguarding its bromine facilities. In 2018, Shouguang City experienced the devastating impact of Typhoon Winbiya, regarded as one of the most destructive typhoons in history, resulting in the region receiving 14 |
Gulf Resources Announces Management ChangesSHOUGUANG, China, Nov. 16, 2023 (GLOBE NEWSWIRE) -- Gulf Resources, Inc. (Nasdaq:GURE) ("Gulf Resources" or the "Company"), a leading manufacturer of bromine, crude salt and specialty chemical products in China, recently disclosed proposed management changes to come into effect during the Company’s annual meeting of shareholders which is to be hold on November 30, 2023 (the “Annual Meeting”), in a Form 8-K filed with the SEC on October 3, 2023. This information was reiterated to ensure sharehold |
GURE Price Returns
| 1-mo | 5.83% |
| 3-mo | -28.29% |
| 6-mo | -11.38% |
| 1-year | -51.34% |
| 3-year | -78.67% |
| 5-year | -76.16% |
| YTD | -33.94% |
| 2023 | -46.60% |
| 2022 | -28.64% |
| 2021 | 5.10% |
| 2020 | 61.54% |
| 2019 | -34.60% |
Continue Researching GURE
Want to do more research on Gulf Resources Inc's stock and its price? Try the links below:Gulf Resources Inc (GURE) Stock Price | Nasdaq
Gulf Resources Inc (GURE) Stock Quote, History and News - Yahoo Finance
Gulf Resources Inc (GURE) Stock Price and Basic Information | MarketWatch
Loading social stream, please wait...