
W.W. Grainger, Inc. (GWW): Price and Financial Metrics
GWW Price/Volume Stats
| Current price | $970.34 | 52-week high | $1,034.18 |
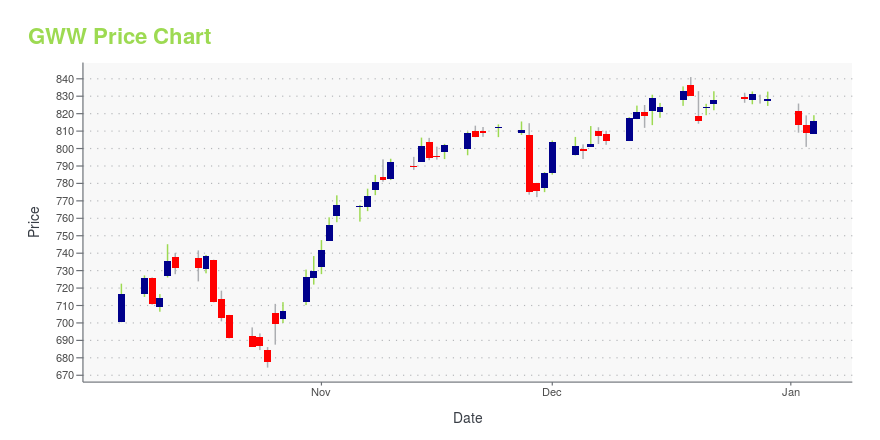
| Prev. close | $954.15 | 52-week low | $674.41 |
| Day low | $960.12 | Volume | 213,314 |
| Day high | $978.38 | Avg. volume | 244,485 |
| 50-day MA | $925.57 | Dividend yield | 0.86% |
| 200-day MA | $890.76 | Market Cap | 47.61B |
GWW Stock Price Chart Interactive Chart >
W.W. Grainger, Inc. (GWW) Company Bio
WW Grainger operates as a distributor of maintenance, repair, and operating (MRO) supplies; and other related products and services that are used by businesses and institutions primarily in the United States and Canada. The company offers material handling equipment, safety and security supplies, lighting and electrical products, power and hand tools, pumps and plumbing supplies, cleaning and maintenance supplies, building and home inspection supplies, vehicle and fleet components, and various other products. The company was founded in 1927 and is based in Lake Forest, Illinois.
Latest GWW News From Around the Web
Below are the latest news stories about WW GRAINGER INC that investors may wish to consider to help them evaluate GWW as an investment opportunity.
Here's Why W.W. Grainger (NYSE:GWW) Can Manage Its Debt ResponsiblySome say volatility, rather than debt, is the best way to think about risk as an investor, but Warren Buffett famously... |
GIC vs. GWW: Which Stock Is the Better Value Option?GIC vs. GWW: Which Stock Is the Better Value Option? |
Why We Like The Returns At W.W. Grainger (NYSE:GWW)If we want to find a potential multi-bagger, often there are underlying trends that can provide clues. Ideally, a... |
Here's Why W.W. Grainger (GWW) Fell More Than Broader MarketW.W. Grainger (GWW) reachead $816.01 at the closing of the latest trading day, reflecting a -1.71% change compared to its last close. |
At US$824, Is It Time To Put W.W. Grainger, Inc. (NYSE:GWW) On Your Watch List?Today we're going to take a look at the well-established W.W. Grainger, Inc. ( NYSE:GWW ). The company's stock received... |
GWW Price Returns
| 1-mo | 6.77% |
| 3-mo | 4.65% |
| 6-mo | 10.31% |
| 1-year | 35.13% |
| 3-year | 120.21% |
| 5-year | 247.23% |
| YTD | 17.58% |
| 2023 | 50.53% |
| 2022 | 8.75% |
| 2021 | 28.80% |
| 2020 | 22.85% |
| 2019 | 22.25% |
GWW Dividends
| Ex-Dividend Date | Type | Payout Amount | Change | ||||||
|---|---|---|---|---|---|---|---|---|---|
| Loading, please wait... | |||||||||
Continue Researching GWW
Want to see what other sources are saying about Ww Grainger Inc's financials and stock price? Try the links below:Ww Grainger Inc (GWW) Stock Price | Nasdaq
Ww Grainger Inc (GWW) Stock Quote, History and News - Yahoo Finance
Ww Grainger Inc (GWW) Stock Price and Basic Information | MarketWatch
Loading social stream, please wait...