Hawaiian Holdings, Inc. (HA): Price and Financial Metrics
HA Price/Volume Stats
Current price | $13.58 | 52-week high | $14.89 |
Prev. close | $13.73 | 52-week low | $3.70 |
Day low | $13.56 | Volume | 605,800 |
Day high | $13.98 | Avg. volume | 1,156,759 |
50-day MA | $13.98 | Dividend yield | N/A |
200-day MA | $10.03 | Market Cap | 703.78M |
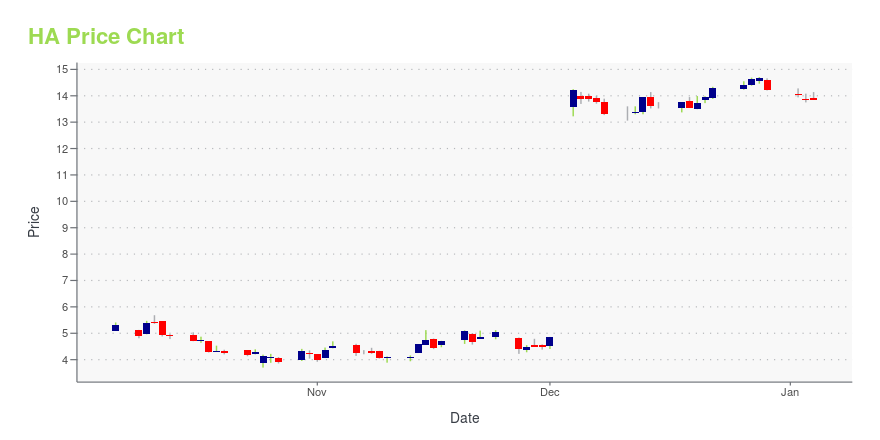
HA Stock Price Chart Interactive Chart >
HA POWR Grades
- HA scores best on the Value dimension, with a Value rank ahead of 43.77% of US stocks.
- HA's strongest trending metric is Momentum; it's been moving down over the last 151 days.
- HA's current lowest rank is in the Stability metric (where it is better than 3.67% of US stocks).
HA Stock Summary
- The capital turnover (annual revenue relative to shareholder's equity) for HA is 15.54 -- better than 97.86% of US stocks.
- HA's price/sales ratio is 0.26; that's higher than the P/S ratio of merely 7.75% of US stocks.
- HA's equity multiplier -- a measure of assets relative to shareholders'equity -- is greater than that of 97.05% of US stocks.
- Stocks with similar financial metrics, market capitalization, and price volatility to HAWAIIAN HOLDINGS INC are QRTEA, BNED, NDLS, AIRT, and CPF.
- HA's SEC filings can be seen here. And to visit HAWAIIAN HOLDINGS INC's official web site, go to www.hawaiianairlines.com.
HA Valuation Summary
- HA's EV/EBIT ratio is -15.4; this is 188.51% lower than that of the median Industrials stock.
- HA's price/sales ratio has moved up 0.2 over the prior 243 months.
Below are key valuation metrics over time for HA.
Stock | Date | P/S | P/B | P/E | EV/EBIT |
---|---|---|---|---|---|
HA | 2023-12-29 | 0.3 | 4.1 | -3.5 | -15.4 |
HA | 2023-12-28 | 0.3 | 4.2 | -3.6 | -15.5 |
HA | 2023-12-27 | 0.3 | 4.2 | -3.6 | -15.5 |
HA | 2023-12-26 | 0.3 | 4.2 | -3.5 | -15.4 |
HA | 2023-12-22 | 0.3 | 4.1 | -3.5 | -15.4 |
HA | 2023-12-21 | 0.3 | 4.0 | -3.4 | -15.3 |
HA Growth Metrics
- The year over year net cashflow from operations growth rate now stands at 164.3%.
- Its 4 year net income to common stockholders growth rate is now at -80.42%.
- Its 5 year revenue growth rate is now at 8.79%.
The table below shows HA's growth in key financial areas (numbers in millions of US dollars).
Date | Revenue | Operating Cash Flow | Net Income to Common Stock |
---|---|---|---|
2022-12-31 | 2,641.267 | -57.752 | -240.081 |
2022-09-30 | 2,404.971 | -84.012 | -282.495 |
2022-06-30 | 2,172.665 | -134.274 | -237.488 |
2022-03-31 | 1,891.581 | 151.483 | -206.891 |
2021-12-31 | 1,596.584 | 251.338 | -144.773 |
2021-09-30 | 1,251.529 | 174.074 | -214.759 |
HA's Quality Factors
The “Quality” component of the POWR Ratings focuses on 31 different factors of a companies fundamentals and operational strength. Here are some key insights as we drill into the specifics of these quality attributes.- HA has a Quality Grade of C, ranking ahead of 60.7% of graded US stocks.
- HA's asset turnover comes in at 0.262 -- ranking 79th of 137 Transportation stocks.
- AAL, SAVE, and UAL are the stocks whose asset turnover ratios are most correlated with HA.
The table below shows HA's key quality metrics over time.
Period | Asset Turnover | Gross Margin | ROIC |
---|---|---|---|
2021-09-30 | 0.262 | 0.354 | -0.038 |
2021-06-30 | 0.179 | 0.229 | -0.078 |
2021-03-31 | 0.110 | -0.042 | -0.120 |
2020-12-31 | 0.208 | 0.269 | -0.158 |
2020-09-30 | 0.343 | 0.409 | -0.091 |
2020-06-30 | 0.510 | 0.488 | -0.032 |
HA Price Target
For more insight on analysts targets of HA, see our HA price target page. And for a list of of all stocks sorted by upside potential based on analyst target price, see our Top Price Target page.
Average Price Target | $22.31 | Average Broker Recommendation | 2.11 (Hold) |
Hawaiian Holdings, Inc. (HA) Company Bio
Hawaiian Holdings is Hawaii's biggest and longest-serving airline, as well as the largest provider of passenger air service from its primary visitor markets on the U.S. mainland. The company was founded in 1929 and is based in Honolulu, Hawaii.
Latest HA News From Around the Web
Below are the latest news stories about HAWAIIAN HOLDINGS INC that investors may wish to consider to help them evaluate HA as an investment opportunity.
A Junk Bond Fund That Delivers High-Quality ReturnsManager David Sherman applies value-investing principles to high-yield bonds. It’s working out well for investors in the CrossingBridge Low Duration High Yield fund. |
Airline Mergers Give Us Something to Talk AboutA proposed merger between Alaska Airlines and Hawaiian Airlines could help Alaska take market share over time. |
S&P 500’s Latest Roster Updates: The Top 3 New Faces to Invest in NowThe rebalancing for the S&P 500 and its mid-cap and small-cap stablemates occurred on Dec. |
The Score: Spotify Technology, CVS Health, Alphabet and More Stocks That Defined the WeekAlaska Air reached a deal to pay roughly $1 billion in cash to buy rival Hawaiian Airlines. The deal will be subject to scrutiny by antitrust authorities, which have also targeted JetBlue Airways ’ merger with Spirit Airlines and JetBlue’s partnership with American Airlines. Spotify is ending 2023 with a third round of layoffs. |
Hawaiian acquired by Alaska Air, AbbVie boasters portfolio: 4 big deal reportsInvesting.com — Here is your Pro Recap of 4 head-turning deal dispatches you may have missed this week: deals at Hawaiian and Alaska Air , AbbVie and Cerevel, Carrier Global selling security unit to Honeywell, and LyondellBasell Industries selling its Ethylene Oxide & Derivatives unit to INEOS Oxide. |
HA Price Returns
1-mo | -3.00% |
3-mo | -1.09% |
6-mo | 86.28% |
1-year | 68.28% |
3-year | -51.57% |
5-year | -45.89% |
YTD | -4.37% |
2023 | 38.40% |
2022 | -44.15% |
2021 | 3.79% |
2020 | -39.32% |
2019 | 12.83% |
Continue Researching HA
Want to do more research on Hawaiian Holdings Inc's stock and its price? Try the links below:Hawaiian Holdings Inc (HA) Stock Price | Nasdaq
Hawaiian Holdings Inc (HA) Stock Quote, History and News - Yahoo Finance
Hawaiian Holdings Inc (HA) Stock Price and Basic Information | MarketWatch
Loading social stream, please wait...