Haemonetics Corporation (HAE): Price and Financial Metrics

Haemonetics Corporation (HAE): $80.29

0.30 (-0.37%)

POWR Rating

Component Grades

Momentum

D

Stability

B

Sentiment

Quality

B

HAE Price/Volume Stats
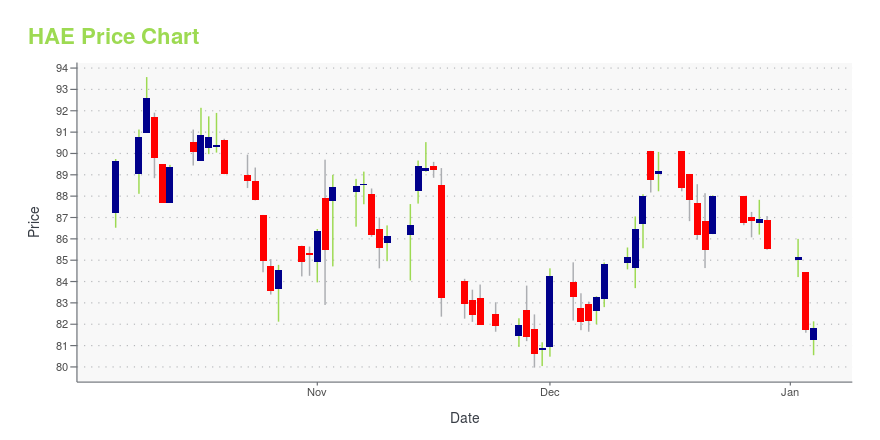
Current price $80.29 52-week high $95.26
Prev. close $80.59 52-week low $72.26
Day low $80.04 Volume 47,589
Day high $81.16 Avg. volume 320,388
50-day MA $87.10 Dividend yield N/A
200-day MA $85.54 Market Cap 4.07B

HAE Stock Price Chart Interactive Chart >

HAE POWR Grades

  • Sentiment is the dimension where HAE ranks best; there it ranks ahead of 88.49% of US stocks.
  • The strongest trend for HAE is in Value, which has been heading down over the past 177 days.
  • HAE ranks lowest in Momentum; there it ranks in the 9th percentile.

HAE Stock Summary

  • With a one year PEG ratio of 128.28, HAEMONETICS CORP is expected to have a higher PEG ratio (a measure of how expensive a stock is relative to its expected earnings growth) than 80.75% of US stocks.
  • HAEMONETICS CORP's stock had its IPO on May 10, 1991, making it an older stock than 84.31% of US equities in our set.
  • The volatility of HAEMONETICS CORP's share price is greater than that of merely 6.39% US stocks with at least 200 days of trading history.
  • Stocks that are quantitatively similar to HAE, based on their financial statements, market capitalization, and price volatility, are CMCO, ASH, XGN, XRX, and LXFR.
  • HAE's SEC filings can be seen here. And to visit HAEMONETICS CORP's official web site, go to www.haemonetics.com.

HAE Valuation Summary

  • In comparison to the median Healthcare stock, HAE's price/earnings ratio is 44.03% higher, now standing at 35.
  • HAE's price/sales ratio has moved up 2 over the prior 243 months.

Below are key valuation metrics over time for HAE.

Stock Date P/S P/B P/E EV/EBIT
HAE 2023-11-03 3.6 5.0 35.0 29.2
HAE 2023-11-02 3.5 4.9 33.8 28.3
HAE 2023-11-01 3.6 5.1 32.1 27.2
HAE 2023-10-31 3.5 5.0 31.6 26.8
HAE 2023-10-30 3.5 5.0 31.5 26.7
HAE 2023-10-27 3.5 5.0 31.4 26.6

HAE Growth Metrics

    The 3 year cash and equivalents growth rate now stands at 53.23%.
  • Its 3 year net income to common stockholders growth rate is now at -21.16%.
  • Its 5 year net income to common stockholders growth rate is now at 391.33%.
HAE's revenue has moved up $243,130,000 over the prior 70 months.

The table below shows HAE's growth in key financial areas (numbers in millions of US dollars).

Date Revenue Operating Cash Flow Net Income to Common Stock
2022-12-31 1,129.246 261.497 95.759
2022-09-30 1,083.714 259.515 86.047
2022-06-30 1,026.126 215.936 67.706
2022-03-31 993.196 172.263 43.375
2021-12-31 953.223 105.76 22.593
2021-09-30 933.825 109.618 31.243

HAE's Quality Factors

The “Quality” component of the POWR Ratings focuses on 31 different factors of a companies fundamentals and operational strength. Here are some key insights as we drill into the specifics of these quality attributes.
  • HAE has a Quality Grade of C, ranking ahead of 50% of graded US stocks.
  • HAE's asset turnover comes in at 0.569 -- ranking 76th of 186 Medical Equipment stocks.
  • CRY, CTSO, and CSII are the stocks whose asset turnover ratios are most correlated with HAE.

The table below shows HAE's key quality metrics over time.

Period Asset Turnover Gross Margin ROIC
2021-07-03 0.569 0.460 0.072
2021-04-03 0.581 0.457 0.090
2020-12-26 0.650 0.486 0.150
2020-09-26 0.674 0.485 0.151
2020-06-27 0.738 0.485 0.142
2020-03-28 0.798 0.490 0.116

HAE Price Target

For more insight on analysts targets of HAE, see our HAE price target page. And for a list of of all stocks sorted by upside potential based on analyst target price, see our Top Price Target page.

Average Price Target $79.25 Average Broker Recommendation 1.38 (Strong Buy)

Haemonetics Corporation (HAE) Company Bio


Haemonetics designs, manufactures, and markets blood management solutions. The Company serves in three markets, such as manufacturers of plasma-derived pharmaceuticals, blood collectors, and hospitals. The company was founded in 1971 and is based in Braintree, Massachusetts.


HAE Latest News Stream


Event/Time News Detail
Loading, please wait...

HAE Latest Social Stream


Loading social stream, please wait...

View Full HAE Social Stream

Latest HAE News From Around the Web

Below are the latest news stories about HAEMONETICS CORP that investors may wish to consider to help them evaluate HAE as an investment opportunity.

Here's Why Haemonetics (HAE) is a Strong Growth Stock

The Zacks Style Scores offers investors a way to easily find top-rated stocks based on their investing style. Here's why you should take advantage.

Yahoo | November 23, 2023

EssilorLuxottica (ESLOY), Moncler Ink Luxury Eyewear Deal

The first Moncler Lunettes collection produced with EssilorLuxottica (ESLOY) is called Fall-Winter 2024.

Yahoo | November 23, 2023

Here's Why You Should Retain Edward Lifesciences (EW) Stock Now

Investors remain optimistic about Edward Lifesciences (EW) due to Surgical's differentiated portfolio and TMTT franchise.

Yahoo | November 23, 2023

Quest Diagnostics' (DGX) New Pact to Advance Cancer Screening

Quest Diagnostics' (DGX) latest partnership will increase the likelihood that Americans will eventually have an easy, reliable and accessible way to check for colorectal cancer.

Yahoo | November 22, 2023

Abbott (ABT) Benefits From Innovation Amid FX Headwinds

Abbott's (ABT) mAbxience collaboration is likely to help introduce cutting-edge medicines in the areas of oncology, women's health and respiratory diseases.

Yahoo | November 22, 2023

Read More 'HAE' Stories Here

HAE Price Returns

1-mo -5.80%
3-mo -11.03%
6-mo -8.90%
1-year -5.88%
3-year -28.85%
5-year -25.16%
YTD 2.09%
2022 48.28%
2021 -55.33%
2020 3.35%
2019 14.84%
2018 72.26%

Get Free Updates

Join thousands of investors who get the latest news, insights and top rated picks from StockNews.com!