The Hain Celestial Group, Inc. (HAIN): Price and Financial Metrics
GET POWR RATINGS... FREE!
HAIN POWR Grades
- Growth is the dimension where HAIN ranks best; there it ranks ahead of 77.58% of US stocks.
- The strongest trend for HAIN is in Quality, which has been heading down over the past 179 days.
- HAIN ranks lowest in Sentiment; there it ranks in the 19th percentile.
HAIN Stock Summary
- With a year-over-year growth in debt of 118.19%, Hain Celestial Group Inc's debt growth rate surpasses 91.16% of about US stocks.
- Over the past twelve months, HAIN has reported earnings growth of 137.58%, putting it ahead of 85.21% of US stocks in our set.
- Revenue growth over the past 12 months for Hain Celestial Group Inc comes in at -10.37%, a number that bests only 10.61% of the US stocks we're tracking.
- Stocks with similar financial metrics, market capitalization, and price volatility to Hain Celestial Group Inc are MMS, SXI, ADUS, TPH, and SBCF.
- HAIN's SEC filings can be seen here. And to visit Hain Celestial Group Inc's official web site, go to www.hain.com.
HAIN Valuation Summary
- In comparison to the median Consumer Defensive stock, HAIN's price/sales ratio is 33.33% lower, now standing at 1.8.
- HAIN's price/sales ratio has moved up 0.4 over the prior 243 months.
- Over the past 243 months, HAIN's price/sales ratio has gone up 0.4.
Below are key valuation metrics over time for HAIN.
Stock | Date | P/S | P/B | P/E | EV/EBIT |
---|---|---|---|---|---|
HAIN | 2021-09-03 | 1.8 | 2.4 | 47.0 | 30.5 |
HAIN | 2021-09-02 | 1.9 | 2.4 | 47.7 | 30.9 |
HAIN | 2021-09-01 | 1.9 | 2.4 | 47.7 | 30.9 |
HAIN | 2021-08-31 | 1.9 | 2.4 | 47.1 | 30.6 |
HAIN | 2021-08-30 | 1.9 | 2.4 | 47.3 | 30.7 |
HAIN | 2021-08-27 | 1.8 | 2.3 | 45.5 | 29.6 |
HAIN Growth Metrics
- Its 4 year net cashflow from operations growth rate is now at -61.76%.
- The 4 year revenue growth rate now stands at -27.29%.
- Its 3 year cash and equivalents growth rate is now at -50.54%.

The table below shows HAIN's growth in key financial areas (numbers in millions of US dollars).
Date | Revenue | Operating Cash Flow | Net Income to Common Stock |
---|---|---|---|
2021-12-31 | 1,875.101 | 160.26 | 125.039 |
2021-09-30 | 1,926.578 | 193.676 | 96.29 |
2021-06-30 | 1,970.302 | 196.759 | 77.364 |
2021-03-31 | 2,031.395 | 239.737 | 40.118 |
2020-12-31 | 2,092.088 | 244.235 | 30.203 |
2020-09-30 | 2,070.454 | 203.442 | 27.099 |
HAIN's Quality Factors
The “Quality” component of the POWR Ratings focuses on 31 different factors of a companies fundamentals and operational strength. Here are some key insights as we drill into the specifics of these quality attributes.- HAIN has a Quality Grade of C, ranking ahead of 48.81% of graded US stocks.
- HAIN's asset turnover comes in at 0.884 -- ranking 28th of 59 Food Products stocks.
- POST, FRPT, and LW are the stocks whose asset turnover ratios are most correlated with HAIN.
The table below shows HAIN's key quality metrics over time.
Period | Asset Turnover | Gross Margin | ROIC |
---|---|---|---|
2021-06-30 | 0.884 | 0.250 | 0.126 |
2021-03-31 | 0.914 | 0.251 | 0.098 |
2020-12-31 | 0.941 | 0.244 | 0.066 |
2020-09-30 | 0.930 | 0.235 | 0.058 |
2020-06-30 | 0.918 | 0.227 | -0.052 |
2020-03-31 | 0.899 | 0.210 | -0.072 |
HAIN Price Target
For more insight on analysts targets of HAIN, see our HAIN price target page. And for a list of of all stocks sorted by upside potential based on analyst target price, see our Top Price Target page.
Average Price Target | $44.30 | Average Broker Recommendation | 1.67 (Moderate Buy) |
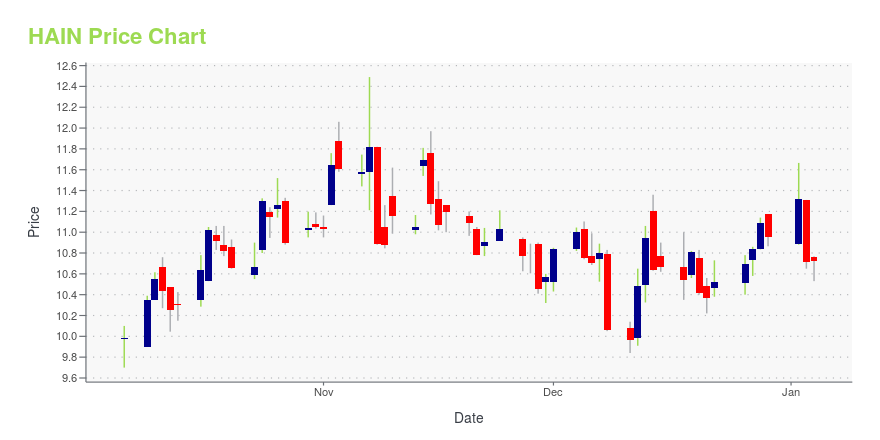
HAIN Stock Price Chart Interactive Chart >
HAIN Price/Volume Stats
Current price | $26.01 | 52-week high | $48.88 |
Prev. close | $25.70 | 52-week low | $24.11 |
Day low | $25.81 | Volume | 33,516 |
Day high | $26.09 | Avg. volume | 955,487 |
50-day MA | $31.50 | Dividend yield | N/A |
200-day MA | $37.80 | Market Cap | 2.34B |
The Hain Celestial Group, Inc. (HAIN) Company Bio
Hain Celestial Group is a leading organic and natural products company with operations in North America, Europe and India. The company was founded in 1993 and is based in Lake Success, New York.
Latest HAIN News From Around the Web
Below are the latest news stories about Hain Celestial Group Inc that investors may wish to consider to help them evaluate HAIN as an investment opportunity.
The Hain Celestial Group, Inc.'s (NASDAQ:HAIN) Intrinsic Value Is Potentially 73% Above Its Share PriceHow far off is The Hain Celestial Group, Inc. ( NASDAQ:HAIN ) from its intrinsic value? Using the most recent financial... |
Hain Celestial (HAIN) Receives a Buy from Mizuho SecuritiesIn a report issued on February 6, John Baumgartner from Mizuho Securities maintained a Buy rating on Hain Celestial (HAIN – Research Report), with a price target of $47.00. The company's shares closed last Wednesday at $36.94. According to TipRanks.com, Baumgartner is a 4-star analyst with an average return of 10.7% and a 71.6% success rate. Baumgartner covers the Consumer Goods sector, focusing on stocks such as Mondelez International, Simply Good Foods, and Beyond Meat. The word on The Street in general, suggests a Moderate Buy analyst consensus rating for Hain Celestial with a $46.67 average price target, representing a 24.8% upside. |
Hain Celestial's (HAIN) Q2 Earnings Beat Estimates, Sales SoftHain Celestial (HAIN) posts mixed results for second-quarter fiscal 2022. HAIN witnesses inflation, and industry-wide distribution and warehousing costs in the quarter. |
Maxim Group Sticks to Its Buy Rating for Hain Celestial (HAIN)Maxim Group analyst Anthony Vendetti maintained a Buy rating on Hain Celestial (HAIN – Research Report) yesterday and set a price target of $63.00. The company's shares closed last Friday at $37.16. According to TipRanks.com, Vendetti is a 4-star analyst with an average return of 6.3% and a 37.1% success rate. Vendetti covers the Healthcare sector, focusing on stocks such as ReShape Lifesciences, Milestone Scientific, and Dermata Therapeutics. The word on The Street in general, suggests a Moderate Buy analyst consensus rating for Hain Celestial with a $48.71 average price target, which is a 31.0% upside from current levels. |
Hain Celestial profit beats but sales missHain Celestial Group Inc. undefined reported fiscal second-quarter net income of $30.9 million, or 33 cents per share, up from $2.1 million, or 2 cents per |
HAIN Price Returns
1-mo | -23.09% |
3-mo | -28.09% |
6-mo | -37.52% |
1-year | -36.12% |
3-year | 15.70% |
5-year | -27.39% |
YTD | -38.96% |
2021 | 6.13% |
2020 | 54.69% |
2019 | 63.65% |
2018 | -62.59% |
2017 | 8.61% |
Continue Researching HAIN
Want to do more research on Hain Celestial Group Inc's stock and its price? Try the links below:Hain Celestial Group Inc (HAIN) Stock Price | Nasdaq
Hain Celestial Group Inc (HAIN) Stock Quote, History and News - Yahoo Finance
Hain Celestial Group Inc (HAIN) Stock Price and Basic Information | MarketWatch
Loading social stream, please wait...