
Hallmark Financial Services, Inc. (HALL): Price and Financial Metrics
HALL Price/Volume Stats
| Current price | $0.00 | 52-week high | $6.24 |
| Prev. close | $0.00 | 52-week low | $0.00 |
| Day low | $0.00 | Volume | 100 |
| Day high | $0.00 | Avg. volume | 14,674 |
| 50-day MA | $0.47 | Dividend yield | N/A |
| 200-day MA | $1.65 | Market Cap | 5.43K |
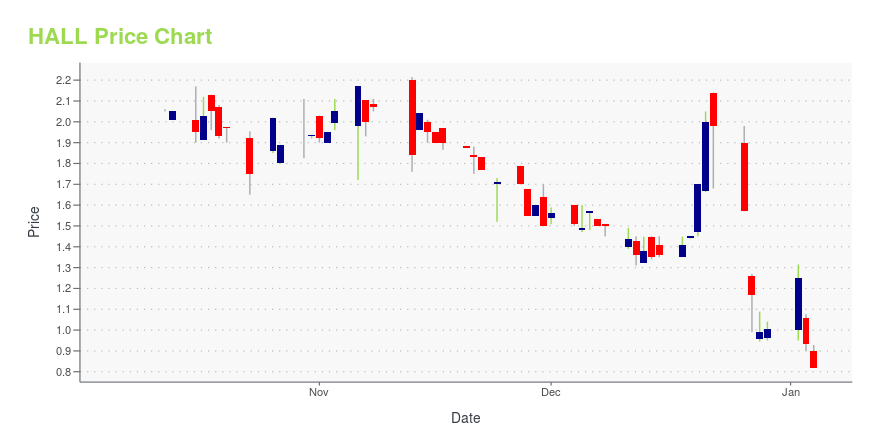
HALL Stock Price Chart Interactive Chart >
Hallmark Financial Services, Inc. (HALL) Company Bio
Hallmark Financial Services, Inc., an insurance holding company, markets, distributes, underwrites, and services property/casualty insurance products to businesses and individuals in the United States. The company operates in the Standard Commercial, Specialty Commercial, and Personal segments. The company was founded in 1987 and is based in Fort Worth, Texas.
Latest HALL News From Around the Web
Below are the latest news stories about HALLMARK FINANCIAL SERVICES INC that investors may wish to consider to help them evaluate HALL as an investment opportunity.
Hallmark Announces Third Quarter ResultsHallmark Financial Services, Inc. Hallmark Financial Services, Inc. DALLAS, Nov. 14, 2023 (GLOBE NEWSWIRE) -- Hallmark Financial Services, Inc. (“Hallmark”) (NASDAQ: HALL) today filed its Form 10-Q and announced financial results for the third quarter and nine months ended September 30, 2023. Third Quarter Year-to-Date 20232022 20232022$ in millions: Net loss from continuing operations$(16.7)$(29.2) $(73.7)$(104.9)Net (loss) income from discontinued operations$(4.8)$1.1 $1.1 $4.2 Net loss$(21.5) |
Today’s Biggest Pre-Market Stock Movers: 10 Top Gainers and Losers on TuesdayWe're starting off Tuesday with a breakdown of the biggest pre-market stock movers investors will want to keep an eye on! |
Hallmark Announces Second Quarter ResultsHallmark Financial Services, Inc. Hallmark Financial Services, Inc. DALLAS, Aug. 14, 2023 (GLOBE NEWSWIRE) -- Hallmark Financial Services, Inc. (“Hallmark”) (NASDAQ: HALL) today filed its Form 10-Q and announced financial results for the second quarter and six months ended June 30, 2023. Second Quarter Year-to-Date 2023 2022 2023 2022 $ in millions: Net loss from continuing operations$(17.8)$(67.0) $(57.0)$(78.7)Net income (loss) from discontinued operations$5.9 $(2.4) $6.0 $6.1 Net loss$(11.9)$ |
One Hallmark Financial Services Insider Raised Stake By 34% In Previous YearLooking at Hallmark Financial Services, Inc.'s ( NASDAQ:HALL ) insider transactions over the last year, we can see that... |
Hallmark Announces Final Arbitration AwardHallmark Financial Services, Inc. Hallmark Financial Services, Inc. DALLAS, June 05, 2023 (GLOBE NEWSWIRE) -- Hallmark Financial Services, Inc. (“Hallmark”) (NASDAQ: HALL) received the final determination in an arbitration proceeding relating to a Loss Portfolio Transfer Reinsurance Contract with DARAG Bermuda Ltd. and DARAG Insurance Limited and certain of Hallmark’s subsidiaries. On June 2, 2023, a final definitive binding award was declared by the arbitration panel which will result in a writ |
HALL Price Returns
| 1-mo | 0.00% |
| 3-mo | 0.00% |
| 6-mo | 0.00% |
| 1-year | 0.00% |
| 3-year | 0.00% |
| 5-year | 0.00% |
| YTD | 0.00% |
| 2023 | -82.78% |
| 2022 | -86.57% |
| 2021 | 22.19% |
| 2020 | -79.74% |
| 2019 | 64.36% |
Continue Researching HALL
Want to see what other sources are saying about Hallmark Financial Services Inc's financials and stock price? Try the links below:Hallmark Financial Services Inc (HALL) Stock Price | Nasdaq
Hallmark Financial Services Inc (HALL) Stock Quote, History and News - Yahoo Finance
Hallmark Financial Services Inc (HALL) Stock Price and Basic Information | MarketWatch
Loading social stream, please wait...