Haynes International, Inc. (HAYN): Price and Financial Metrics
HAYN Price/Volume Stats
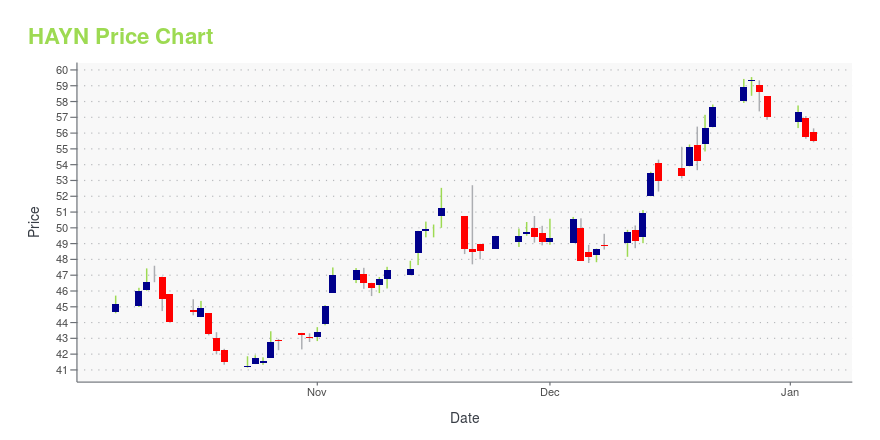
Current price | $45.52 | 52-week high | $60.85 |
Prev. close | $46.34 | 52-week low | $34.94 |
Day low | $45.52 | Volume | 5,623 |
Day high | $46.41 | Avg. volume | 61,999 |
50-day MA | $48.70 | Dividend yield | 1.93% |
200-day MA | $49.47 | Market Cap | 579.56M |
HAYN Stock Price Chart Interactive Chart >
HAYN POWR Grades
- Momentum is the dimension where HAYN ranks best; there it ranks ahead of 76.95% of US stocks.
- HAYN's strongest trending metric is Growth; it's been moving down over the last 177 days.
- HAYN ranks lowest in Value; there it ranks in the 20th percentile.
HAYN Stock Summary
- With a year-over-year growth in debt of 92.94%, HAYNES INTERNATIONAL INC's debt growth rate surpasses 89.14% of about US stocks.
- As for revenue growth, note that HAYN's revenue has grown 29.7% over the past 12 months; that beats the revenue growth of 81.18% of US companies in our set.
- In terms of volatility of its share price, HAYN is more volatile than merely 15.83% of stocks we're observing.
- Stocks with similar financial metrics, market capitalization, and price volatility to HAYNES INTERNATIONAL INC are OPTN, RMTI, IMPL, SPWR, and TTI.
- Visit HAYN's SEC page to see the company's official filings. To visit the company's web site, go to www.haynesintl.com.
HAYN Valuation Summary
- In comparison to the median Industrials stock, HAYN's price/sales ratio is 8.33% lower, now standing at 1.1.
- Over the past 201 months, HAYN's price/sales ratio has gone down 0.4.
Below are key valuation metrics over time for HAYN.
Stock | Date | P/S | P/B | P/E | EV/EBIT |
---|---|---|---|---|---|
HAYN | 2023-09-19 | 1.1 | 1.5 | 13.4 | 11.1 |
HAYN | 2023-09-18 | 1.1 | 1.5 | 13.5 | 11.2 |
HAYN | 2023-09-15 | 1.1 | 1.5 | 13.8 | 11.4 |
HAYN | 2023-09-14 | 1.1 | 1.5 | 13.9 | 11.5 |
HAYN | 2023-09-13 | 1.1 | 1.5 | 13.5 | 11.2 |
HAYN | 2023-09-12 | 1.1 | 1.5 | 13.8 | 11.4 |
HAYN Growth Metrics
- Its 3 year net cashflow from operations growth rate is now at -390.87%.
- Its 4 year price growth rate is now at -44.85%.
- Its 5 year price growth rate is now at -44.85%.

The table below shows HAYN's growth in key financial areas (numbers in millions of US dollars).
Date | Revenue | Operating Cash Flow | Net Income to Common Stock |
---|---|---|---|
2022-12-31 | 523.704 | -62.746 | 48.167 |
2022-09-30 | 490.461 | -79.481 | 45.087 |
2022-06-30 | 441.929 | -74.524 | 31.305 |
2022-03-31 | 399.907 | -44.669 | 16.119 |
2021-12-31 | 364.914 | -19.022 | 4.003 |
2021-09-30 | 337.661 | 23.265 | -8.683 |
HAYN's Quality Factors
The “Quality” component of the POWR Ratings focuses on 31 different factors of a companies fundamentals and operational strength. Here are some key insights as we drill into the specifics of these quality attributes.- HAYN has a Quality Grade of C, ranking ahead of 63.31% of graded US stocks.
- HAYN's asset turnover comes in at 0.577 -- ranking 33rd of 41 Steel Works Etc stocks.
- BOOM, ATI, and AQMS are the stocks whose asset turnover ratios are most correlated with HAYN.
The table below shows HAYN's key quality metrics over time.
Period | Asset Turnover | Gross Margin | ROIC |
---|---|---|---|
2021-06-30 | 0.577 | 0.084 | -0.044 |
2021-03-31 | 0.554 | 0.051 | -0.066 |
2020-12-31 | 0.588 | 0.078 | -0.043 |
2020-09-30 | 0.636 | 0.117 | -0.012 |
2020-06-30 | 0.709 | 0.144 | 0.017 |
2020-03-31 | 0.789 | 0.163 | 0.047 |
HAYN Price Target
For more insight on analysts targets of HAYN, see our HAYN price target page. And for a list of of all stocks sorted by upside potential based on analyst target price, see our Top Price Target page.
Average Price Target | $45.00 | Average Broker Recommendation | 1.33 (Strong Buy) |
Haynes International, Inc. (HAYN) Company Bio
Haynes International produces nickel and cobalt-based alloys in flat product form such as sheet, coil, and plate forms. The Company is focused on developing, manufacturing, marketing, and distributing technologically advanced, high-performance alloys, which are sold primarily in the aerospace, chemical processing, and land-based gas turbine industries. The company was founded in 1912 and is based in Kokomo, Indiana.
Latest HAYN News From Around the Web
Below are the latest news stories about HAYNES INTERNATIONAL INC that investors may wish to consider to help them evaluate HAYN as an investment opportunity.
Haynes International (HAYN) Q3 Earnings and Revenues Top EstimatesHaynes International (HAYN) delivered earnings and revenue surprises of 1.49% and 0.64%, respectively, for the quarter ended June 2023. Do the numbers hold clues to what lies ahead for the stock? |
Haynes International, Inc. Reports Third Quarter Fiscal 2023 Financial ResultsCompany record backlog of $468.1 million as of June 30, 2023, up 38.4% year-over-year, with continued strength in aerospace and industrial gas turbine demand.Net revenue of $143.9 million, reduced by an estimated $18-$20 million due to a cybersecurity incident. Company is now back to full production and expects to make up the third quarter cyber-related revenue impact over the next few quarters. Margin compression from the impact of the cybersecurity incident, along with raw material headwinds, |
Haynes International, Inc. to Host Third Quarter Fiscal Year 2023 Conference CallCompany to host conference call on August 4, 2023 at 9:00 AM ET KOKOMO, Ind., July 25, 2023 (GLOBE NEWSWIRE) -- Haynes International, Inc. (NASDAQ GM: HAYN) a leading developer, manufacturer and marketer of technologically advanced high performance alloys, announced today that it will host a conference call on Friday, August 4, 2023 to discuss its third quarter financial results for the period ended June 30, 2023. A press release announcing the results will be issued after market close on August |
Earnings Preview: Haynes International (HAYN) Q3 Earnings Expected to DeclineHaynes International (HAYN) doesn't possess the right combination of the two key ingredients for a likely earnings beat in its upcoming report. Get prepared with the key expectations. |
Haynes International Provides Cybersecurity Update and Estimated Third Quarter Financial ImpactKOKOMO, Ind., July 19, 2023 (GLOBE NEWSWIRE) -- Haynes International, Inc. (NASDAQ GM: HAYN) (the “Company”), a leading developer, manufacturer and marketer of technologically advanced high-performance alloys, provided an update today regarding the recent cybersecurity incident including the estimated quarterly financial impact. As previously disclosed, the Company began experiencing a network outage indicative of a cybersecurity incident on June 10, 2023. Upon detection of the incident, the Com |
HAYN Price Returns
1-mo | -4.40% |
3-mo | -5.07% |
6-mo | -6.02% |
1-year | 31.54% |
3-year | 180.99% |
5-year | 46.80% |
YTD | 1.00% |
2022 | 15.73% |
2021 | 73.43% |
2020 | -30.74% |
2019 | 39.21% |
2018 | -15.73% |
HAYN Dividends
Ex-Dividend Date | Type | Payout Amount | Change | ||||||
---|---|---|---|---|---|---|---|---|---|
Loading, please wait... |
Continue Researching HAYN
Want to see what other sources are saying about Haynes International Inc's financials and stock price? Try the links below:Haynes International Inc (HAYN) Stock Price | Nasdaq
Haynes International Inc (HAYN) Stock Quote, History and News - Yahoo Finance
Haynes International Inc (HAYN) Stock Price and Basic Information | MarketWatch
Loading social stream, please wait...