
Hayward Holdings, Inc. (HAYW): Price and Financial Metrics
HAYW Price/Volume Stats
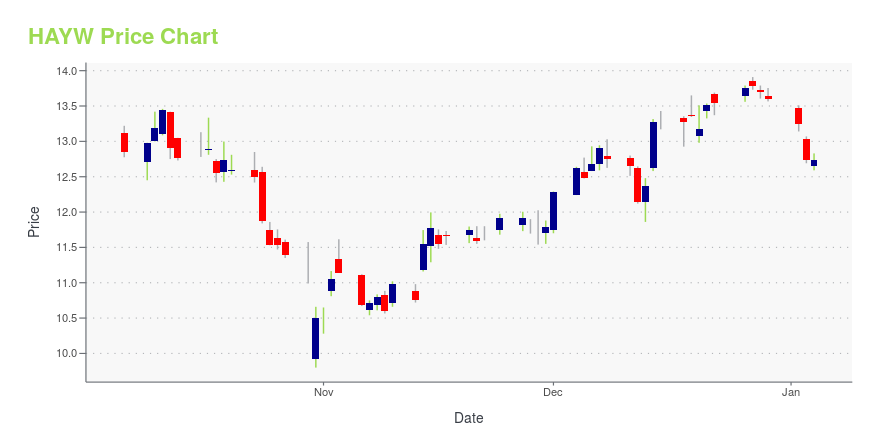
| Current price | $13.46 | 52-week high | $16.04 |
| Prev. close | $12.81 | 52-week low | $9.80 |
| Day low | $13.07 | Volume | 1,701,959 |
| Day high | $13.56 | Avg. volume | 1,305,993 |
| 50-day MA | $13.32 | Dividend yield | N/A |
| 200-day MA | $13.14 | Market Cap | 2.89B |
HAYW Stock Price Chart Interactive Chart >
Hayward Holdings, Inc. (HAYW) Company Bio
Hayward Holdings, Inc. engages in the manufacture and sale of pool equipment and associated automation systems. Its business segments include North America, and Europe and Rest of the World. The company was founded on June 1, 2017 and is headquartered in Berkeley Heights, NJ.
Latest HAYW News From Around the Web
Below are the latest news stories about HAYWARD HOLDINGS INC that investors may wish to consider to help them evaluate HAYW as an investment opportunity.
Hayward Holdings, Inc.'s (NYSE:HAYW) Stock Has Seen Strong Momentum: Does That Call For Deeper Study Of Its Financial Prospects?Most readers would already be aware that Hayward Holdings' (NYSE:HAYW) stock increased significantly by 14% over the... |
Hayward Announces Leadership TransitionCHARLOTTE, N.C., December 04, 2023--Hayward Holdings, Inc. (NYSE: HAYW) ("Hayward"), a global designer, manufacturer, and marketer of a broad portfolio of pool and outdoor living technology, announced today the promotion of John Collins to Chief Commercial Officer (CCO), effective immediately. In his new role, John will lead the Company’s sales, marketing, customer service and product management teams in North America, as well as the global industrial Flow Control business. |
Hayward Holdings' (NYSE:HAYW) Returns Have Hit A WallDid you know there are some financial metrics that can provide clues of a potential multi-bagger? Firstly, we'd want to... |
Hayward Holdings, Inc. (NYSE:HAYW) Q3 2023 Earnings Call TranscriptHayward Holdings, Inc. (NYSE:HAYW) Q3 2023 Earnings Call Transcript October 31, 2023 Operator: Welcome to Hayward Holdings Third Quarter 2023 Earnings Call. My name is Svangel and I will be your operator for today’s call. Later, we will conduct a question-and-answer session. [Operator Instructions] Please note that this conference is being recorded. I will now […] |
Q3 2023 Hayward Holdings Inc Earnings CallQ3 2023 Hayward Holdings Inc Earnings Call |
HAYW Price Returns
| 1-mo | 10.96% |
| 3-mo | -2.25% |
| 6-mo | 6.91% |
| 1-year | 0.82% |
| 3-year | -44.70% |
| 5-year | N/A |
| YTD | -1.03% |
| 2023 | 44.68% |
| 2022 | -64.16% |
| 2021 | N/A |
| 2020 | N/A |
| 2019 | N/A |
Loading social stream, please wait...