Hanesbrands Inc. (HBI): Price and Financial Metrics
GET POWR RATINGS... FREE!
HBI POWR Grades
- HBI scores best on the Value dimension, with a Value rank ahead of 93.56% of US stocks.
- HBI's strongest trending metric is Momentum; it's been moving down over the last 179 days.
- HBI ranks lowest in Sentiment; there it ranks in the 8th percentile.
HBI Stock Summary
- The capital turnover (annual revenue relative to shareholder's equity) for HBI is 9.68 -- better than 96.86% of US stocks.
- HBI's equity multiplier -- a measure of assets relative to shareholders'equity -- is greater than that of 94.97% of US stocks.
- In terms of twelve month growth in earnings before interest and taxes, Hanesbrands Inc is reporting a growth rate of -1,906.25%; that's higher than merely 1.06% of US stocks.
- Stocks that are quantitatively similar to HBI, based on their financial statements, market capitalization, and price volatility, are USFD, DXYN, AVT, M, and ALTG.
- HBI's SEC filings can be seen here. And to visit Hanesbrands Inc's official web site, go to www.hanes.com.
HBI Valuation Summary
- HBI's price/sales ratio is 1; this is 67.74% lower than that of the median Consumer Cyclical stock.
- HBI's EV/EBIT ratio has moved down 40.4 over the prior 182 months.
- HBI's price/sales ratio has moved up 0.6 over the prior 182 months.
Below are key valuation metrics over time for HBI.
Stock | Date | P/S | P/B | P/E | EV/EBIT |
---|---|---|---|---|---|
HBI | 2021-08-27 | 1 | 12.1 | -18.6 | -35.4 |
HBI | 2021-08-26 | 1 | 11.9 | -18.3 | -35.0 |
HBI | 2021-08-25 | 1 | 12.3 | -19.0 | -35.8 |
HBI | 2021-08-24 | 1 | 12.0 | -18.6 | -35.4 |
HBI | 2021-08-23 | 1 | 11.9 | -18.5 | -35.2 |
HBI | 2021-08-20 | 1 | 11.8 | -18.2 | -34.9 |
HBI Growth Metrics
- Its 5 year price growth rate is now at -64.53%.
- Its 4 year cash and equivalents growth rate is now at 226.03%.
- Its 2 year net income to common stockholders growth rate is now at 626.26%.

The table below shows HBI's growth in key financial areas (numbers in millions of US dollars).
Date | Revenue | Operating Cash Flow | Net Income to Common Stock |
---|---|---|---|
2021-12-31 | 6,801.24 | 623.409 | 77.224 |
2021-09-30 | 6,849.734 | 744.623 | -314.973 |
2021-06-30 | 6,868.449 | 678.518 | -363.472 |
2021-03-31 | 6,855.917 | 548.631 | -330.967 |
2020-12-31 | 6,664.35 | 448.469 | -75.579 |
2020-09-30 | 6,614.512 | 789.954 | 436.075 |
HBI's Quality Factors
The “Quality” component of the POWR Ratings focuses on 31 different factors of a companies fundamentals and operational strength. Here are some key insights as we drill into the specifics of these quality attributes.- HBI has a Quality Grade of B, ranking ahead of 75.3% of graded US stocks.
- HBI's asset turnover comes in at 0.912 -- ranking 142nd of 165 Retail stocks.
- SPH, BOOT, and SIG are the stocks whose asset turnover ratios are most correlated with HBI.
The table below shows HBI's key quality metrics over time.
Period | Asset Turnover | Gross Margin | ROIC |
---|---|---|---|
2021-07-03 | 0.912 | 0.295 | -0.045 |
2021-04-03 | 0.886 | 0.288 | -0.037 |
2021-01-02 | 0.835 | 0.277 | -0.002 |
2020-09-26 | 0.838 | 0.368 | 0.094 |
2020-06-27 | 0.856 | 0.379 | 0.107 |
2020-03-28 | 0.865 | 0.384 | 0.106 |
HBI Price Target
For more insight on analysts targets of HBI, see our HBI price target page. And for a list of of all stocks sorted by upside potential based on analyst target price, see our Top Price Target page.
Average Price Target | $22.91 | Average Broker Recommendation | 1.71 (Moderate Buy) |
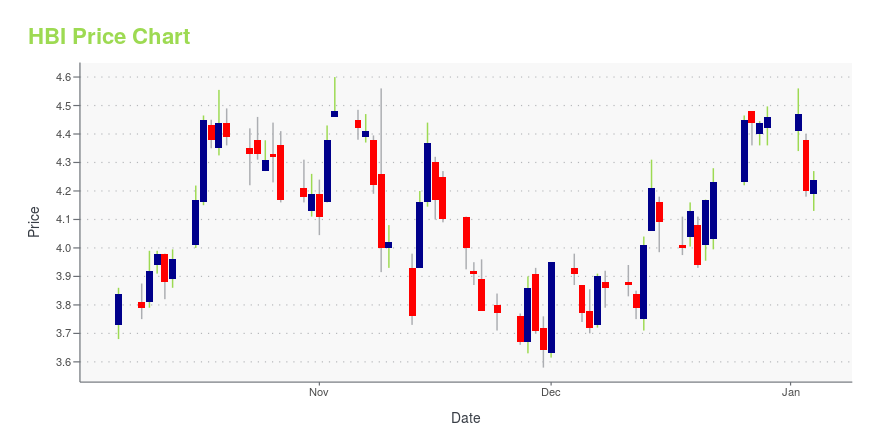
HBI Stock Price Chart Interactive Chart >
HBI Price/Volume Stats
Current price | $11.44 | 52-week high | $20.74 |
Prev. close | $11.15 | 52-week low | $10.94 |
Day low | $11.10 | Volume | 8,412,318 |
Day high | $11.74 | Avg. volume | 5,431,078 |
50-day MA | $13.81 | Dividend yield | 5.16% |
200-day MA | $16.29 | Market Cap | 3.99B |
Hanesbrands Inc. (HBI) Company Bio
Hanesbrands Inc. designs, manufactures, sources, and sells a range of basic apparels for men, women, and children in the United States. The company operates through four segments: Innerwear, Activewear, Direct to Consumer, and International, which are comprised of bras, panties, shapewears, hosiery, mens underwear, childrens underwear, and socks; and other activewear, such as T-shirts, fleece, sport shirts, performance T-shirts and shorts, sports bras, and thermals, as well as licensed logo apparel in collegiate bookstores and other channels. The company was founded in 2005 and is based in Winston-Salem, North Carolina.
Latest HBI News From Around the Web
Below are the latest news stories about Hanesbrands Inc that investors may wish to consider to help them evaluate HBI as an investment opportunity.
Hanesbrands Is Too Cheap To Ignore And Set To SoarNo summary available. |
Here Are Reasons Why Hanesbrands Inc. (NYSE: HBI) Is A Great Choice NowThe trading price of Hanesbrands Inc. (NYSE:HBI) closed higher on Tuesday, February 15, closing at $15.48, 1.31% higher than its previous close. >> 5 Best Growth Stocks for 2022 << >> 5 Best Growth Stocks for 2022 << Traders who pay close attention to intraday price movement should know that it fluctuated between $15.37 and … Here Are Reasons Why Hanesbrands Inc. (NYSE: HBI) Is A Great Choice Now Read More » |
Recap: Magna International Q4 EarningsMagna International (NYSE: MGA ) reported its Q4 earnings results on Friday, February 11, 2022 at 05:00 AM. Here''s what investors need to know about the announcement. Also check this: Hanesbrands And 2 Other Stocks Bought By Insiders Earnings Magna International missed estimated earnings Full story available on Benzinga.com |
Recap: AllianceBernstein Holding Q4 EarningsAllianceBernstein Holding (NYSE: AB ) reported its Q4 earnings results on Friday, February 11, 2022 at 06:20 AM. Here''s what investors need to know about the announcement. Also check this: Hanesbrands And 2 Other Stocks Bought By Insiders Earnings AllianceBernstein Holding beat estimated earnings … Full story available on Benzinga.com |
Essent Group: Q4 Earnings InsightsEssent Gr (NYSE: ESNT ) reported its Q4 earnings results on Friday, February 11, 2022 at 06:30 AM. Here''s what investors need to know about the announcement. Also check this: Hanesbrands And 2 Other Stocks Bought By Insiders Earnings Essent Gr beat estimated earnings Full story available on Benzinga.com |
HBI Price Returns
1-mo | -17.36% |
3-mo | -23.68% |
6-mo | -30.49% |
1-year | -37.77% |
3-year | -17.99% |
5-year | -33.32% |
YTD | -30.08% |
2021 | 18.43% |
2020 | 3.22% |
2019 | 22.90% |
2018 | -38.04% |
2017 | -0.28% |
HBI Dividends
Ex-Dividend Date | Type | Payout Amount | Change | ||||||
---|---|---|---|---|---|---|---|---|---|
Loading, please wait... |
Continue Researching HBI
Here are a few links from around the web to help you further your research on Hanesbrands Inc's stock as an investment opportunity:Hanesbrands Inc (HBI) Stock Price | Nasdaq
Hanesbrands Inc (HBI) Stock Quote, History and News - Yahoo Finance
Hanesbrands Inc (HBI) Stock Price and Basic Information | MarketWatch
Loading social stream, please wait...