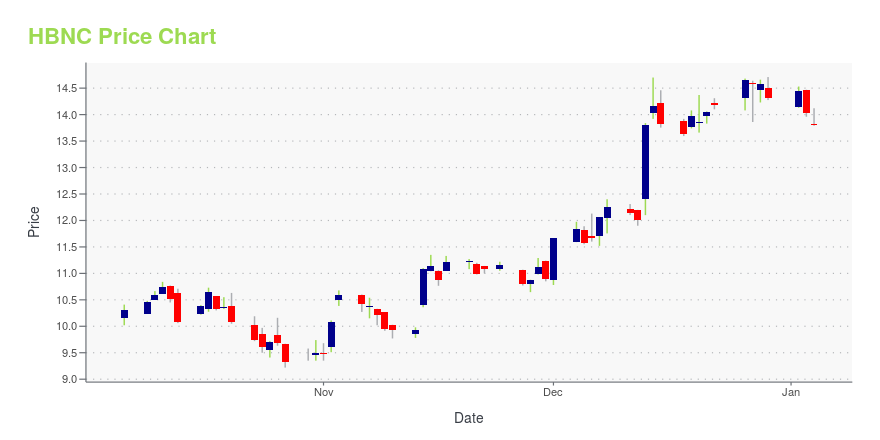
Horizon Bancorp, Inc. (HBNC): Price and Financial Metrics
HBNC Price/Volume Stats
| Current price | $16.37 | 52-week high | $16.62 |
| Prev. close | $16.30 | 52-week low | $9.22 |
| Day low | $16.02 | Volume | 221,853 |
| Day high | $16.62 | Avg. volume | 164,574 |
| 50-day MA | $12.76 | Dividend yield | 4.16% |
| 200-day MA | $12.25 | Market Cap | 722.18M |
HBNC Stock Price Chart Interactive Chart >
Horizon Bancorp, Inc. (HBNC) Company Bio
Horizon Bancorp provides commercial and retail banking services in Northwestern and Central Indiana, and Southwestern and Central Michigan. The company was founded in 1873 and is based in Michigan, Indiana.
Latest HBNC News From Around the Web
Below are the latest news stories about HORIZON BANCORP INC that investors may wish to consider to help them evaluate HBNC as an investment opportunity.
Horizon Bancorp, Inc. Announces Earnings Conference Call to Review Fourth Quarter and Full Year 2023 Results on January 25MICHIGAN CITY, Ind., Dec. 18, 2023 (GLOBE NEWSWIRE) -- (NASDAQ GS: HBNC) – Horizon Bancorp, Inc. (“Horizon” or the “Company”) will host a conference call at 7:30 a.m. CT on Thursday, January 25, 2024 to review its fourth quarter and full year 2023 financial results. The Company’s fourth quarter and full year 2023 news release will be released after markets close on Wednesday, January 24, 2024. It will be available in the “Investor Relations” section of the Company’s website, www.horizonbank.com. |
Horizon in Indiana takes $33M hit in balance sheet restructuringThe Michigan City company, part of a growing list of banks announcing similar overhauls, aims to sell nearly $400 million of securities and reinvest the proceeds in higher-yielding loans. |
Horizon Bancorp (HBNC) Surges 15.1%: Is This an Indication of Further Gains?Horizon Bancorp (HBNC) was a big mover last session on higher-than-average trading volume. The latest trend in earnings estimate revisions might not help the stock continue moving higher in the near term. |
Horizon Bancorp, Inc. Announces Balance Sheet RepositioningMICHIGAN CITY, Ind., Dec. 12, 2023 (GLOBE NEWSWIRE) -- (NASDAQ GS: HBNC) – Horizon Bancorp, Inc. (“Horizon” or the “Company”), the parent company of Horizon Bank (the “Bank”), announced the execution of a balance sheet repositioning related to its investment securities portfolio and bank owned life insurance policies. The Company sold $382.7 million in available-for-sale (“AFS”) securities, composed of treasury, agency, corporate, and municipal securities with a weighted average book yield of 2. |
Horizon Bancorp, Inc. Announces Key Leadership ChangesMICHIGAN CITY, Ind., Nov. 07, 2023 (GLOBE NEWSWIRE) -- (NASDAQ GS: HBNC) – Horizon Bancorp, Inc. (“Horizon” or the “Company”) announced the succession plan for its chief financial officer (“CFO”) and a restructuring of its mortgage and consumer lending leadership. Horizon and Mark Secor have agreed that he will transition from his role as Executive Vice President and CFO of the Company and Horizon Bank. Mr. Secor will continue in the role of Executive Vice President and CFO until a successor is |
HBNC Price Returns
| 1-mo | 40.32% |
| 3-mo | 42.24% |
| 6-mo | 22.22% |
| 1-year | 38.27% |
| 3-year | 15.91% |
| 5-year | 15.65% |
| YTD | 18.79% |
| 2023 | 0.43% |
| 2022 | -25.26% |
| 2021 | 35.43% |
| 2020 | -12.86% |
| 2019 | 23.69% |
HBNC Dividends
| Ex-Dividend Date | Type | Payout Amount | Change | ||||||
|---|---|---|---|---|---|---|---|---|---|
| Loading, please wait... | |||||||||
Continue Researching HBNC
Want to do more research on Horizon Bancorp Inc's stock and its price? Try the links below:Horizon Bancorp Inc (HBNC) Stock Price | Nasdaq
Horizon Bancorp Inc (HBNC) Stock Quote, History and News - Yahoo Finance
Horizon Bancorp Inc (HBNC) Stock Price and Basic Information | MarketWatch


Loading social stream, please wait...