
HBT FINANCIAL, INC. (HBT): Price and Financial Metrics
HBT Price/Volume Stats
| Current price | $24.24 | 52-week high | $24.85 |
| Prev. close | $23.90 | 52-week low | $17.42 |
| Day low | $23.97 | Volume | 20,522 |
| Day high | $24.25 | Avg. volume | 26,942 |
| 50-day MA | $20.29 | Dividend yield | 3.11% |
| 200-day MA | $19.54 | Market Cap | 765.77M |
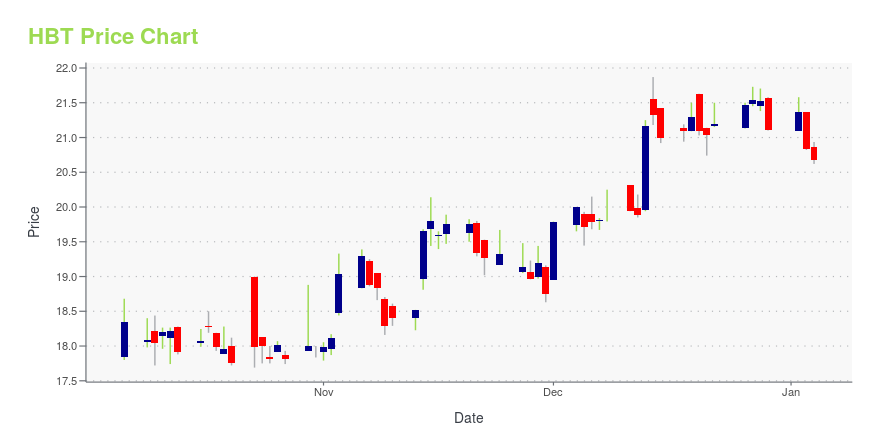
HBT Stock Price Chart Interactive Chart >
HBT FINANCIAL, INC. (HBT) Company Bio
HBT Financial, Inc. operates as a bank holding company. It provides business, commercial and retail banking products and services to businesses, families and local governments, through its subsidiaries. The company was founded in 1920 and is headquartered in Bloomington, IL.
Latest HBT News From Around the Web
Below are the latest news stories about HBT FINANCIAL INC that investors may wish to consider to help them evaluate HBT as an investment opportunity.
HBT Financial (HBT) Rewards Shareholders With New Buyback PlanHBT Financial (HBT) announces a new share buyback program worth up to $15 million. This will commence after the expiration of the current program and continue till Jan 1, 2025. |
HBT Financial, Inc. Announces Authorization of New $15 Million Stock Repurchase ProgramBLOOMINGTON, Ill., Dec. 20, 2023 (GLOBE NEWSWIRE) -- HBT Financial, Inc. (NASDAQ: HBT) (the “Company” or “HBT Financial”) announced today that its Board of Directors has approved a new stock repurchase program (the “Program”) that takes effect upon the expiration of the Company’s current stock repurchase program on January 1, 2024. The Company will not execute additional repurchases under the current program after January 1, 2024. The new Program authorizes the Company to repurchase up to $15 mi |
HBT Financial (HBT) Soars 6.4%: Is Further Upside Left in the Stock?HBT Financial (HBT) was a big mover last session on higher-than-average trading volume. The latest trend in earnings estimate revisions might not help the stock continue moving higher in the near term. |
HBT Financial (HBT) Reports Q3 Earnings: What Key Metrics Have to SayWhile the top- and bottom-line numbers for HBT Financial (HBT) give a sense of how the business performed in the quarter ended September 2023, it could be worth looking at how some of its key metrics compare to Wall Street estimates and year-ago values. |
HBT Financial Inc. Reports Strong Third Quarter 2023 Financial ResultsNet income of $19.7 million, adjusted net income of $20.3 million, and robust asset quality highlight the quarter |
HBT Price Returns
| 1-mo | 26.78% |
| 3-mo | 29.60% |
| 6-mo | 22.46% |
| 1-year | 27.59% |
| 3-year | 61.26% |
| 5-year | N/A |
| YTD | 17.12% |
| 2023 | 11.71% |
| 2022 | 8.11% |
| 2021 | 28.04% |
| 2020 | -16.60% |
| 2019 | N/A |
HBT Dividends
| Ex-Dividend Date | Type | Payout Amount | Change | ||||||
|---|---|---|---|---|---|---|---|---|---|
| Loading, please wait... | |||||||||
Loading social stream, please wait...