
HCA Healthcare Inc. (HCA): Price and Financial Metrics
HCA Price/Volume Stats
| Current price | $354.78 | 52-week high | $356.30 |
| Prev. close | $352.79 | 52-week low | $215.96 |
| Day low | $351.18 | Volume | 1,215,900 |
| Day high | $356.09 | Avg. volume | 1,159,920 |
| 50-day MA | $329.89 | Dividend yield | 0.78% |
| 200-day MA | $297.00 | Market Cap | 92.92B |
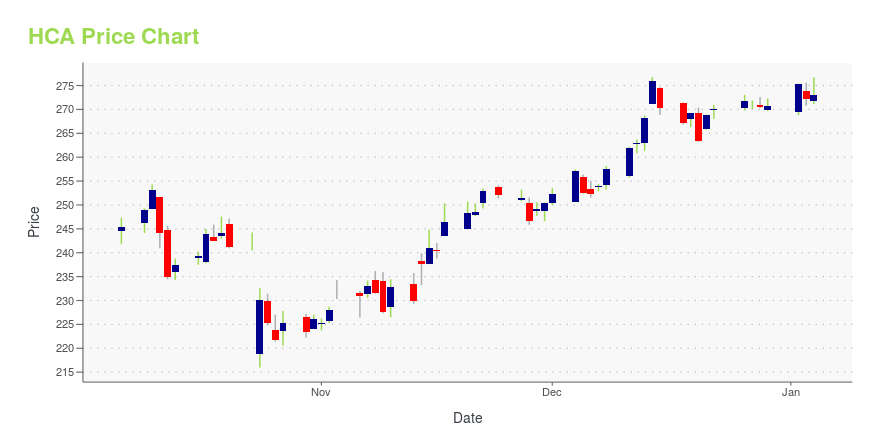
HCA Stock Price Chart Interactive Chart >
HCA Healthcare Inc. (HCA) Company Bio
HCA Healthcare is an American for-profit operator of health care facilities that was founded in 1968. It is based in Nashville, Tennessee, and, as of May 2020, owns and operates 186 hospitals and approximately 2,000 sites of care, including surgery centers, freestanding emergency rooms, urgent care centers and physician clinics in 21 states and the United Kingdom. As of 2021, HCA Healthcare is ranked #62 on the Fortune 500 rankings of the largest United States corporations by total revenue. (Source:Wikipedia)
Latest HCA News From Around the Web
Below are the latest news stories about HCA HEALTHCARE INC that investors may wish to consider to help them evaluate HCA as an investment opportunity.
3 Stocks Set for Success After Surviving Data Breaches in 2023While the share price of companies hit by a data breach often falls in the near term, the long-term doesn’t have to be fatal. |
Reasons to Retain HCA Healthcare (HCA) Stock in Your PortfolioHCA Healthcare's (HCA) improving top line, acquisition initiatives and a robust growth outlook poise the company well for growth. |
HCA Healthcare and the HCA Healthcare Foundation Donate $250,000 to Aid Tornado Relief Efforts in Middle TennesseeNASHVILLE, Tenn., December 21, 2023--HCA Healthcare, Inc. (NYSE:HCA), one of the nation’s leading healthcare providers, and the HCA Healthcare Foundation today announced they are donating $250,000 to aid those impacted by the tornadoes that recently hit Middle Tennessee. The tornadoes, which touched down the afternoon of Saturday, Dec. 9, 2023, devastated multiple counties across Middle Tennessee, destroying homes and leaving thousands without power. |
HCA Healthcare (HCA) Rises Higher Than Market: Key FactsIn the most recent trading session, HCA Healthcare (HCA) closed at $269.18, indicating a +0.75% shift from the previous trading day. |
HCA Healthcare Announces HCA Healthcare Foundation’s Health Equity Catalyst Grant ProgramNASHVILLE, Tenn., December 19, 2023--HCA Healthcare, Inc. (NYSE:HCA), one of the nation’s leading healthcare providers, today announced the HCA Healthcare Foundation, through its Healthier Tomorrow Fund, gave $375,000 in grants to nonprofits as part of its new Health Equity Catalyst Grant Program. This year, the grants were given to nonprofits addressing food insecurity and providing access to healthy foods across the country. |
HCA Price Returns
| 1-mo | 3.35% |
| 3-mo | 15.90% |
| 6-mo | 24.23% |
| 1-year | 30.95% |
| 3-year | 48.24% |
| 5-year | 153.59% |
| YTD | 31.59% |
| 2023 | 13.83% |
| 2022 | -5.64% |
| 2021 | 57.58% |
| 2020 | 11.89% |
| 2019 | 20.24% |
HCA Dividends
| Ex-Dividend Date | Type | Payout Amount | Change | ||||||
|---|---|---|---|---|---|---|---|---|---|
| Loading, please wait... | |||||||||
Continue Researching HCA
Want to see what other sources are saying about HCA Healthcare Inc's financials and stock price? Try the links below:HCA Healthcare Inc (HCA) Stock Price | Nasdaq
HCA Healthcare Inc (HCA) Stock Quote, History and News - Yahoo Finance
HCA Healthcare Inc (HCA) Stock Price and Basic Information | MarketWatch
Loading social stream, please wait...