HEALTH CATALYST, INC. (HCAT): Price and Financial Metrics
HCAT Price/Volume Stats
Current price | $7.52 | 52-week high | $14.37 |
Prev. close | $7.44 | 52-week low | $6.60 |
Day low | $7.47 | Volume | 216,495 |
Day high | $7.74 | Avg. volume | 610,332 |
50-day MA | $8.90 | Dividend yield | N/A |
200-day MA | $9.90 | Market Cap | 440.39M |
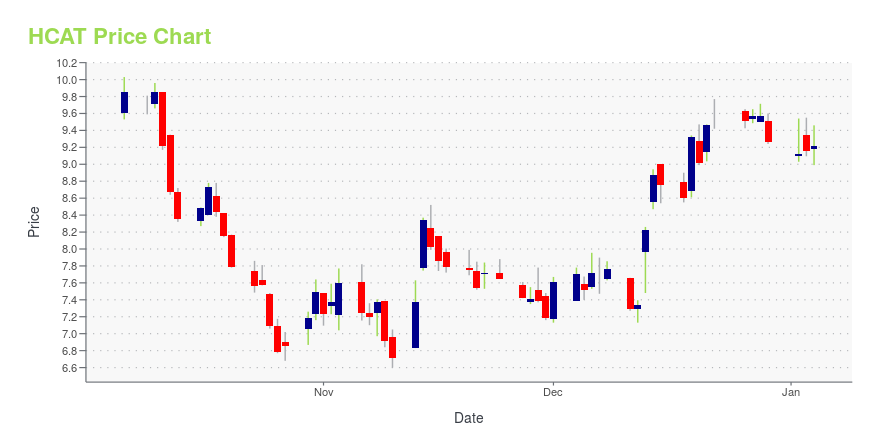
HCAT Stock Price Chart Interactive Chart >
HCAT POWR Grades
- Growth is the dimension where HCAT ranks best; there it ranks ahead of 96.43% of US stocks.
- The strongest trend for HCAT is in Value, which has been heading up over the past 179 days.
- HCAT's current lowest rank is in the Quality metric (where it is better than 18.12% of US stocks).
HCAT Stock Summary
- HEALTH CATALYST INC's stock had its IPO on July 25, 2019, making it an older stock than merely 17.92% of US equities in our set.
- Of note is the ratio of HEALTH CATALYST INC's sales and general administrative expense to its total operating expenses; 31.31% of US stocks have a lower such ratio.
- The volatility of HEALTH CATALYST INC's share price is greater than that of 70.76% US stocks with at least 200 days of trading history.
- Stocks that are quantitatively similar to HCAT, based on their financial statements, market capitalization, and price volatility, are ACCD, PHR, TNDM, ZUO, and VUZI.
- Visit HCAT's SEC page to see the company's official filings. To visit the company's web site, go to www.healthcatalyst.com.
HCAT Valuation Summary
- In comparison to the median Healthcare stock, HCAT's price/earnings ratio is 113.7% lower, now standing at -4.
- Over the past 54 months, HCAT's price/earnings ratio has gone up 0.9.
Below are key valuation metrics over time for HCAT.
Stock | Date | P/S | P/B | P/E | EV/EBIT |
---|---|---|---|---|---|
HCAT | 2023-12-18 | 1.7 | 1.3 | -4.0 | -5.0 |
HCAT | 2023-12-15 | 1.7 | 1.3 | -4.1 | -5.0 |
HCAT | 2023-12-14 | 1.8 | 1.3 | -4.1 | -5.1 |
HCAT | 2023-12-13 | 1.6 | 1.2 | -3.8 | -4.8 |
HCAT | 2023-12-12 | 1.5 | 1.1 | -3.4 | -4.4 |
HCAT | 2023-12-11 | 1.4 | 1.1 | -3.4 | -4.4 |
HCAT's Quality Factors
The “Quality” component of the POWR Ratings focuses on 31 different factors of a companies fundamentals and operational strength. Here are some key insights as we drill into the specifics of these quality attributes.- HCAT has a Quality Grade of D, ranking ahead of 6.31% of graded US stocks.
- HCAT's asset turnover comes in at 0.378 -- ranking 389th of 561 Business Services stocks.
- 500 - Internal server error
The table below shows HCAT's key quality metrics over time.
Period | Asset Turnover | Gross Margin | ROIC |
---|---|---|---|
2021-06-30 | 0.378 | 0.499 | -0.456 |
2021-03-31 | 0.365 | 0.492 | -0.321 |
2020-12-31 | 0.393 | 0.481 | -0.299 |
2020-09-30 | 0.435 | 0.479 | -0.249 |
2020-06-30 | 0.490 | 0.489 | -0.269 |
2020-03-31 | 0.616 | 0.502 | -0.314 |
HCAT Price Target
For more insight on analysts targets of HCAT, see our HCAT price target page. And for a list of of all stocks sorted by upside potential based on analyst target price, see our Top Price Target page.
Average Price Target | $66.00 | Average Broker Recommendation | 1.23 (Strong Buy) |
HEALTH CATALYST, INC. (HCAT) Company Bio
Health Catalyst, Inc. provides data and analytics technology and services to healthcare organizations. Its products include analytics platform, accountable care and financial, benchmarking and comparative analytics, care management and population health, clinical analytics, operations and performance management, patient safety, and services. The company is headquartered in Salt Lake City, Utah.
Latest HCAT News From Around the Web
Below are the latest news stories about HEALTH CATALYST INC that investors may wish to consider to help them evaluate HCAT as an investment opportunity.
Why Are Health Catalyst (HCAT) Shares Soaring TodayShares of healthcare software provider Health Catalyst (NASDAQ:HCAT) jumped 6.5% in the morning session, reflecting the broader market's ongoing uptrend, which some may playfully call the Santa Claus rally (a real observed phenomenon where the market tends to drift upwards during the holiday season for reasons such as optimism and year-end tax considerations for funds and investors). All major indices rose, fueled by growing optimism about the Federal Reserve not only concluding its rate hikes b |
Health Catalyst to Participate in Upcoming Investor ConferenceSALT LAKE CITY, Dec. 14, 2023 (GLOBE NEWSWIRE) -- Health Catalyst, Inc. ("Health Catalyst", Nasdaq: HCAT), a leading provider of data and analytics technology and services to healthcare organizations, today announced that Dan Burton, Chief Executive Officer, Bryan Hunt, Chief Financial Officer, and Adam Brown, Senior Vice President of FP&A and Investor Relations, will participate in the 42nd Annual J.P. Morgan Healthcare Conference, being held in San Francisco. In conjunction, there will be a pr |
Health Catalyst, Inc. (NASDAQ:HCAT) Shares Could Be 49% Below Their Intrinsic Value EstimateKey Insights Using the 2 Stage Free Cash Flow to Equity, Health Catalyst fair value estimate is US$16.28 Health... |
Health Catalyst's Analytics Solutions Save WakeMed Health & Hospitals $10 Million, Accelerates Clinical TransformationHealth Catalyst, Inc. ("Health Catalyst," Nasdaq: HCAT), a leading provider of data and analytics technology and services to healthcare organizations, announced WakeMed Health & Hospitals ("WakeMed") has achieved $10M variable cost reduction by decreasing unnecessary care variation while helping to improve care quality. |
Health Catalyst to Participate in Upcoming Investor ConferencesSALT LAKE CITY, Nov. 24, 2023 (GLOBE NEWSWIRE) -- Health Catalyst, Inc. ("Health Catalyst", Nasdaq: HCAT), a leading provider of data and analytics technology and services to healthcare organizations, today announced that Bryan Hunt, Chief Financial Officer, and Adam Brown, Senior Vice President of FP&A and Investor Relations, will participate in the following upcoming investor conferences: Piper Sandler 35th Annual Healthcare Conference, being held in New York, on Wednesday, November 29, 2023, |
HCAT Price Returns
1-mo | -9.51% |
3-mo | -18.79% |
6-mo | -25.69% |
1-year | -33.51% |
3-year | -83.65% |
5-year | N/A |
YTD | -18.79% |
2023 | -12.89% |
2022 | -73.17% |
2021 | -8.98% |
2020 | 25.45% |
2019 | N/A |
Loading social stream, please wait...