
Hudson Technologies, Inc. (HDSN): Price and Financial Metrics
HDSN Price/Volume Stats
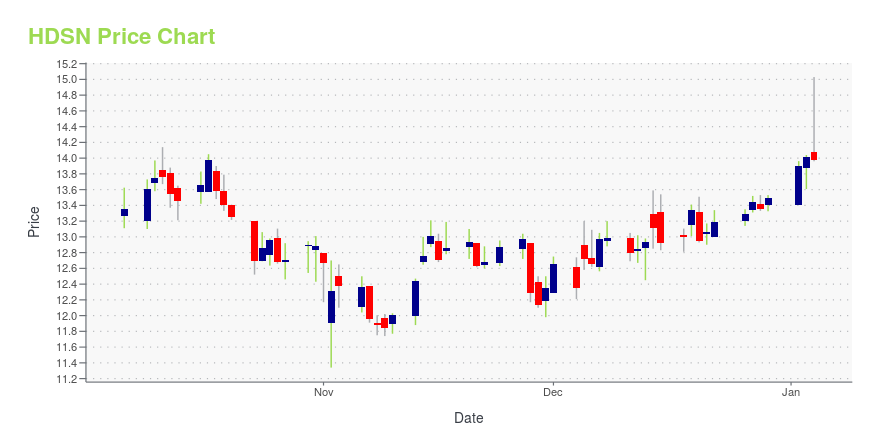
| Current price | $9.04 | 52-week high | $15.24 |
| Prev. close | $8.99 | 52-week low | $7.90 |
| Day low | $8.83 | Volume | 314,136 |
| Day high | $9.10 | Avg. volume | 475,815 |
| 50-day MA | $9.01 | Dividend yield | N/A |
| 200-day MA | $11.52 | Market Cap | 411.42M |
HDSN Stock Price Chart Interactive Chart >
Hudson Technologies, Inc. (HDSN) Company Bio
Hudson Technologies Inc. operates as a refrigerant services company in the United States and internationally. The company sells reclaimed and virgin refrigerants, and industrial gases; and provides refrigerant management services, which primarily include reclamation of refrigerants and laboratory testing. The company was founded in 1991 and is based in Pearl River, New York.
Latest HDSN News From Around the Web
Below are the latest news stories about HUDSON TECHNOLOGIES INC that investors may wish to consider to help them evaluate HDSN as an investment opportunity.
Meridian Small Cap Growth Fund Trimmed Hudson Technologies (HDSN) as the Share Price AppreciatedMeridian Funds, managed by ArrowMark Partners, released its “Meridian Small Cap Growth Fund” third quarter 2023 investor letter. A copy of the same can be downloaded here. The fund returned -10.24% (net) in the third quarter compared to the Russell 2000 Growth Index’s -7.32% return. Overall, underperformance during the quarter resulted from the market’s muted or […] |
Insider Sell: Director Richard Parrillo Sells 72,604 Shares of Hudson Technologies Inc (HDSN)In a notable insider transaction, Director Richard Parrillo of Hudson Technologies Inc (NASDAQ:HDSN) sold 72,604 shares of the company's stock on December 14, 2023. |
Hudson Technologies Participates at COP28; Supports Global Cooling PledgeWOODCLIFF LAKE, N.J., Dec. 14, 2023 (GLOBE NEWSWIRE) -- Hudson Technologies, Inc. (NASDAQ: HDSN) a leading provider of innovative and sustainable refrigerant products and services to the Heating, Ventilation, Air Conditioning, and Refrigeration industry – and one of the nation’s largest refrigerant reclaimers joins the international community in support of the Global Cooling Pledge launched last week at COP28 in Dubai. The Global Cooling Pledge is a joint initiative between the United Arab Emira |
Hudson Technologies' (NASDAQ:HDSN) investors will be pleased with their massive 826% return over the last five yearsFor many, the main point of investing in the stock market is to achieve spectacular returns. And highest quality... |
If You Can Only Buy One Stock, It Better Be One of These 3 NamesApproach investing like you only have a limited number of stocks to buy. |
HDSN Price Returns
| 1-mo | 2.96% |
| 3-mo | -13.33% |
| 6-mo | -24.92% |
| 1-year | 3.79% |
| 3-year | 134.81% |
| 5-year | 1,377.12% |
| YTD | -32.99% |
| 2023 | 33.30% |
| 2022 | 127.93% |
| 2021 | 307.34% |
| 2020 | 11.51% |
| 2019 | 9.83% |
Continue Researching HDSN
Want to see what other sources are saying about Hudson Technologies Inc's financials and stock price? Try the links below:Hudson Technologies Inc (HDSN) Stock Price | Nasdaq
Hudson Technologies Inc (HDSN) Stock Quote, History and News - Yahoo Finance
Hudson Technologies Inc (HDSN) Stock Price and Basic Information | MarketWatch
Loading social stream, please wait...