
Holly Energy Partners, L.P. (HEP): Price and Financial Metrics
HEP Price/Volume Stats
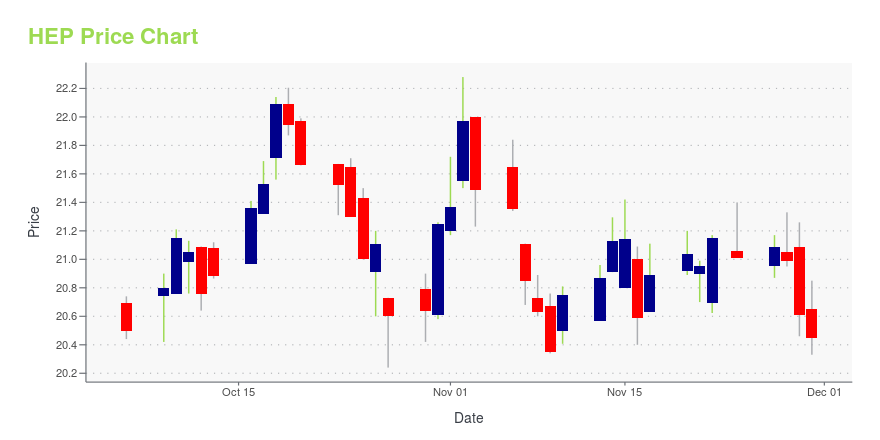
| Current price | $20.45 | 52-week high | $23.62 |
| Prev. close | $20.61 | 52-week low | $15.51 |
| Day low | $20.33 | Volume | 17,217,100 |
| Day high | $20.85 | Avg. volume | 384,703 |
| 50-day MA | $21.24 | Dividend yield | 6.85% |
| 200-day MA | $19.35 | Market Cap | 2.59B |
HEP Stock Price Chart Interactive Chart >
Holly Energy Partners, L.P. (HEP) Company Bio
Holly Energy Partners owns and operates petroleum product and crude pipelines, storage tanks, distribution terminals, and loading rack facilities. The company was founded in 2004 and is based in Dallas, Texas.
Latest HEP News From Around the Web
Below are the latest news stories about HOLLY ENERGY PARTNERS LP that investors may wish to consider to help them evaluate HEP as an investment opportunity.
TortoiseEcofin Announces Constituent Changes Due to Corporate ActionOVERLAND PARK, KS / ACCESSWIRE / November 30, 2023 / TortoiseEcofin today announced that Holly Energy Partners LP (NYSE:HEP) will be removed from the Tortoise MLP Index® (TMLP) and the Tortoise North American Pipeline IndexSM (TNAP) as a result of ... |
HF Sinclair Corporation and Holly Energy Partners, L.P. Announce Expiration and Final Results of Exchange Offers and Consent Solicitations for Outstanding Notes of the HEP IssuersDALLAS, November 30, 2023--HF Sinclair Corporation (NYSE: DINO) ("HF Sinclair") and Holly Energy Partners, L.P. (NYSE: HEP) ("HEP") today announced the expiration and final results of the previously announced (i) private offers to exchange (each an "Exchange Offer" and, collectively, the "Exchange Offers") any and all outstanding (a) 6.375% Senior Notes due 2027 (the "2027 Notes") and (b) 5.000% Senior Notes due 2028 (the "2028 Notes" and, together with the 2027 Notes, the "HEP Notes") previousl |
HF Sinclair Corporation and Holly Energy Partners, L.P. Announce Results of Early Participation in Exchange Offers and Consent Solicitations for Outstanding Notes of the HEP Issuers and Extension of the Early Participation Exchange ConsiderationDALLAS, November 14, 2023--HF Sinclair Corporation (NYSE: DINO) ("HF Sinclair") and Holly Energy Partners, L.P. (NYSE: HEP) ("HEP") today announced that as of 5:00 p.m., New York City time, on November 13, 2023 (the "Early Participation Date"), that $880,229,000 in aggregate principal amount of outstanding HEP Notes (as defined below) previously issued by HEP and Holly Energy Finance Corp. ("Finance Corp." and, together with HEP, the "HEP Issuers"), representing approximately 97.80% of the total |
HF Sinclair Corporation (NYSE:DINO) Q3 2023 Earnings Call TranscriptHF Sinclair Corporation (NYSE:DINO) Q3 2023 Earnings Call Transcript November 2, 2023 HF Sinclair Corporation beats earnings expectations. Reported EPS is $4.06, expectations were $3.81. Operator: Welcome to HF Sinclair Corporation and Holly Energy Partners Third Quarter 2023 Conference Call and Webcast. Hosting the call today is Tim Go, Chief Executive Officer of HF Sinclair. […] |
Holly Energy Partners, L.P. (NYSE:HEP) Q3 2023 Earnings Call TranscriptHolly Energy Partners, L.P. (NYSE:HEP) Q3 2023 Earnings Call Transcript November 2, 2023 Holly Energy Partners, L.P. misses on earnings expectations. Reported EPS is $0.5 EPS, expectations were $0.52. Operator: Welcome to HF Sinclair Corporation and Holly Energy Partners Third Quarter 2023 Conference Call and Webcast. Hosting the call today is Tim Go, Chief Executive […] |
HEP Price Returns
| 1-mo | N/A |
| 3-mo | N/A |
| 6-mo | N/A |
| 1-year | 10.03% |
| 3-year | 18.01% |
| 5-year | 3.77% |
| YTD | N/A |
| 2023 | 0.00% |
| 2022 | 18.73% |
| 2021 | 25.28% |
| 2020 | -28.49% |
| 2019 | -14.47% |
HEP Dividends
| Ex-Dividend Date | Type | Payout Amount | Change | ||||||
|---|---|---|---|---|---|---|---|---|---|
| Loading, please wait... | |||||||||
Continue Researching HEP
Want to do more research on Holly Energy Partners Lp's stock and its price? Try the links below:Holly Energy Partners Lp (HEP) Stock Price | Nasdaq
Holly Energy Partners Lp (HEP) Stock Quote, History and News - Yahoo Finance
Holly Energy Partners Lp (HEP) Stock Price and Basic Information | MarketWatch
Loading social stream, please wait...