
HF Foods Group Inc. (HFFG): Price and Financial Metrics
HFFG Price/Volume Stats
| Current price | $3.34 | 52-week high | $5.91 |
| Prev. close | $3.31 | 52-week low | $2.46 |
| Day low | $3.28 | Volume | 32,258 |
| Day high | $3.35 | Avg. volume | 55,973 |
| 50-day MA | $3.20 | Dividend yield | N/A |
| 200-day MA | $3.94 | Market Cap | 175.72M |
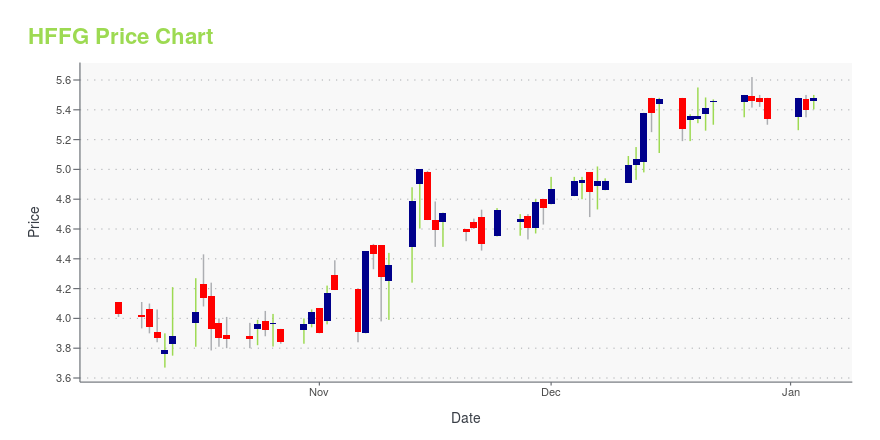
HFFG Stock Price Chart Interactive Chart >
HF Foods Group Inc. (HFFG) Company Bio
HF Foods Group Inc., through its subsidiaries, markets and distributes fresh produces, frozen and dry food products, and non-food products to Asian restaurants, primarily Chinese restaurants, and other foodservice customers throughout the Southeast, Pacific, and Mountain West regions in the United States. The company offers approximately 1,500 products ranging from perishable produce to takeout food packaging materials for its clients. It distributes Asian specialty food items, meat and poultry products, seafood, fresh produce, packaging and other items, and commodities. The company has 14 distribution centers with a fleet of approximately 340 refrigerated vehicles serving approximately 10,000 Asian restaurants. It also provides design and printing services, as well as trucking services. In addition, the company rents warehouse facilities. HF Foods Group Inc. is headquartered in Greensboro, North Carolina.
Latest HFFG News From Around the Web
Below are the latest news stories about HF FOODS GROUP INC that investors may wish to consider to help them evaluate HFFG as an investment opportunity.
Q3 2023 Hf Foods Group Inc Earnings CallQ3 2023 Hf Foods Group Inc Earnings Call |
HF Foods Reports Third Quarter 2023 Financial ResultsPre-Recorded Earnings Call Webcast Available on Investor Relations Website Announces Comprehensive, Operational Transformation Plan to Drive Growth and Cost Savings LAS VEGAS, Nov. 09, 2023 (GLOBE NEWSWIRE) -- HF Foods Group Inc. (NASDAQ: HFFG) (“HF Foods”, or the “Company”), a leading food distributor to Asian restaurants across the United States, reported financial results for the third quarter and nine months ended September 30, 2023. Third Quarter 2023 Financial Results Net revenue decreased |
HF Foods to Report Third Quarter 2023 Results on November 9, 2023Pre-Recorded Earnings Call Webcast Will Be Available on Investor Relations WebsiteLAS VEGAS, Nov. 02, 2023 (GLOBE NEWSWIRE) -- HF Foods Group Inc. (NASDAQ: HFFG), a leading food distributor to Asian restaurants across the United States (“HF Foods” or the “Company”), today announced it will report financial results for the third quarter ended September 30, 2023, on Thursday, November 9, 2023, after-market close. Prepared remarks from members of the executive management team discussing these resul |
Insider Buying: CEO Xiao Zhang Acquires 25,000 Shares of HF Foods Group IncOn September 7, 2023, Xiao Zhang, the CEO of HF Foods Group Inc (NASDAQ:HFFG), made a significant insider purchase of 25,000 shares of the company. |
CEO & Director of HF Foods Group Xiao Mou Zhang Buys 1.6% More SharesPotential HF Foods Group Inc. ( NASDAQ:HFFG ) shareholders may wish to note that the CEO & Director, Xiao Mou Zhang... |
HFFG Price Returns
| 1-mo | 4.05% |
| 3-mo | 15.37% |
| 6-mo | -39.71% |
| 1-year | -36.02% |
| 3-year | -36.02% |
| 5-year | -85.60% |
| YTD | -37.45% |
| 2023 | 31.53% |
| 2022 | -52.01% |
| 2021 | 12.50% |
| 2020 | -61.44% |
| 2019 | 46.62% |
Continue Researching HFFG
Here are a few links from around the web to help you further your research on HF Foods Group Inc's stock as an investment opportunity:HF Foods Group Inc (HFFG) Stock Price | Nasdaq
HF Foods Group Inc (HFFG) Stock Quote, History and News - Yahoo Finance
HF Foods Group Inc (HFFG) Stock Price and Basic Information | MarketWatch
Loading social stream, please wait...