
Heritage Global Inc. (HGBL): Price and Financial Metrics
HGBL Price/Volume Stats
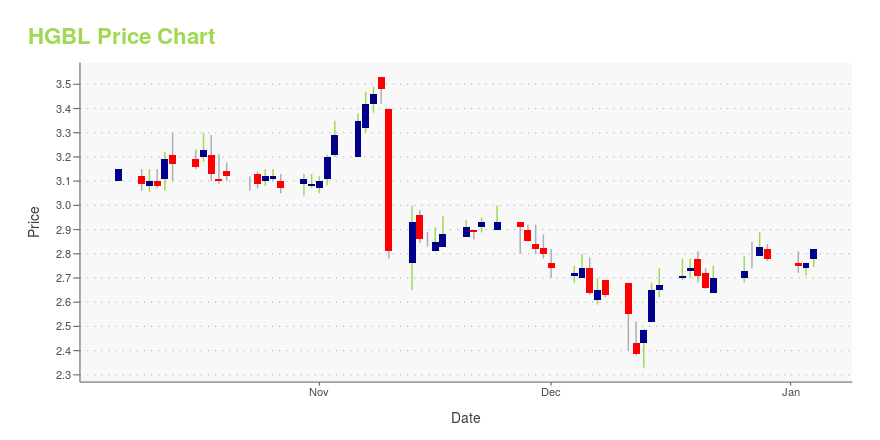
| Current price | $2.42 | 52-week high | $3.89 |
| Prev. close | $2.37 | 52-week low | $2.12 |
| Day low | $2.38 | Volume | 10,545 |
| Day high | $2.42 | Avg. volume | 70,239 |
| 50-day MA | $2.39 | Dividend yield | N/A |
| 200-day MA | $2.70 | Market Cap | 90.37M |
HGBL Stock Price Chart Interactive Chart >
Heritage Global Inc. (HGBL) Company Bio
Heritage Global Inc. is an asset services company with focus on financial and industrial asset transactions. The company provides services including market making, acquisitions, dispositions, valuations, and secured lending. It focuses on identifying, valuing, acquiring, and monetizing underlying tangible and intangible assets. Heritage Global Inc. acts as an adviser, as well as a principal, acquiring or brokering turnkey manufacturing facilities; surplus industrial machinery and equipment; industrial inventories; accounts receivable portfolios; intellectual property; and entire business enterprises. The company was formerly known as Counsel RB Capital Inc. and changed its name to Heritage Global Inc. in August 2013. Heritage Global Inc. was incorporated in 1983 and is headquartered in San Diego, California.
Latest HGBL News From Around the Web
Below are the latest news stories about HERITAGE GLOBAL INC that investors may wish to consider to help them evaluate HGBL as an investment opportunity.
Retail investors account for 46% of Heritage Global Inc.'s (NASDAQ:HGBL) ownership, while institutions account for 27%Key Insights Heritage Global's significant retail investors ownership suggests that the key decisions are influenced by... |
Heritage Global Inc. (NASDAQ:HGBL) Q3 2023 Earnings Call TranscriptHeritage Global Inc. (NASDAQ:HGBL) Q3 2023 Earnings Call Transcript November 11, 2023 Operator: Ladies and gentlemen, greetings, and welcome to the Heritage Global Inc. Third Quarter 2023 Earnings Conference Call. [Operator Instructions]. As a reminder, this conference is being recorded. It is now my pleasure to introduce your host, John Nesbett, with IMS Investor Relations. […] |
Heritage Global Inc. Just Missed Earnings - But Analysts Have Updated Their ModelsIt's been a mediocre week for Heritage Global Inc. ( NASDAQ:HGBL ) shareholders, with the stock dropping 15% to US$2.81... |
Heritage Global Inc. Reports Strong Third Quarter 2023 ResultsSAN DIEGO, November 09, 2023--Heritage Global Inc. (NASDAQ: HGBL) ("Heritage Global," "HG" or "the Company"), an asset services company specializing in financial and industrial asset transactions, today reported financial results for the third quarter and nine months ended September 30, 2023. |
Heritage Global Valuations Appoints Gina Griffin as Senior Vice PresidentSAN DIEGO, Calif., November 02, 2023--Heritage Global Valuations ("HGV"), a division of Heritage Global Inc. (NASDAQ: HGBL), a leading appraisal and liquidation firm, is pleased to announce the appointment of Gina Griffin as Senior Vice President. With a remarkable career spanning more than two decades, Griffin brings a wealth of expertise in the appraisal and liquidation industry, particularly in retail, consumer products, and e-commerce. |
HGBL Price Returns
| 1-mo | 2.98% |
| 3-mo | -2.02% |
| 6-mo | -16.55% |
| 1-year | -35.64% |
| 3-year | 25.39% |
| 5-year | N/A |
| YTD | -12.95% |
| 2023 | 18.30% |
| 2022 | 25.67% |
| 2021 | -29.70% |
| 2020 | 171.98% |
| 2019 | 115.18% |
Loading social stream, please wait...