Howard Hughes Corp. (HHC): Price and Financial Metrics
HHC Price/Volume Stats
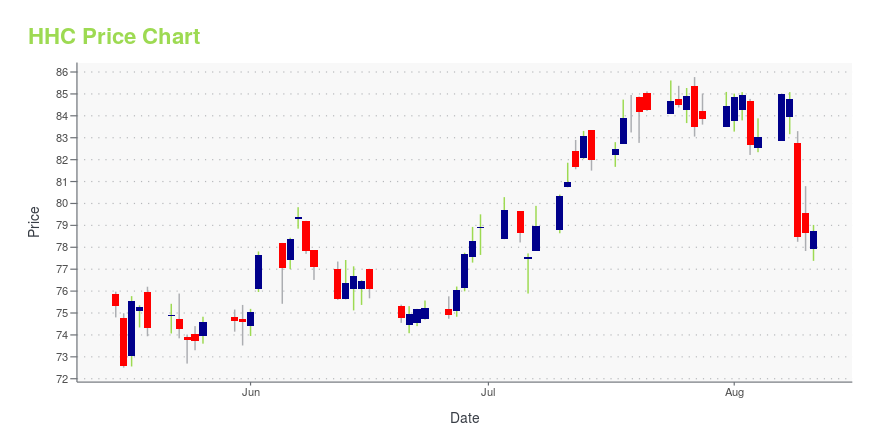
Current price | $77.64 | 52-week high | $89.58 |
Prev. close | $75.04 | 52-week low | $50.90 |
Day low | $75.96 | Volume | 143,200 |
Day high | $77.81 | Avg. volume | 205,701 |
50-day MA | $75.87 | Dividend yield | N/A |
200-day MA | $72.92 | Market Cap | 3.88B |
HHC Stock Price Chart Interactive Chart >
HHC POWR Grades
- HHC scores best on the Stability dimension, with a Stability rank ahead of 39.97% of US stocks.
- HHC's strongest trending metric is Stability; it's been moving up over the last 179 days.
- HHC ranks lowest in Growth; there it ranks in the 3rd percentile.
HHC Stock Summary
- HHC's one year PEG ratio, measuring expected growth in earnings next year relative to current common stock price is 120.5 -- higher than 80.76% of US-listed equities with positive expected earnings growth.
- Of note is the ratio of HOWARD HUGHES CORP's sales and general administrative expense to its total operating expenses; just 12.26% of US stocks have a lower such ratio.
- The ratio of debt to operating expenses for HOWARD HUGHES CORP is higher than it is for about 96.08% of US stocks.
- If you're looking for stocks that are quantitatively similar to HOWARD HUGHES CORP, a group of peers worth examining would be BXP, AHH, VNO, FRT, and LSI.
- Visit HHC's SEC page to see the company's official filings. To visit the company's web site, go to www.howardhughes.com.
HHC Valuation Summary
- In comparison to the median Real Estate stock, HHC's price/sales ratio is 43.9% lower, now standing at 2.3.
- Over the past 152 months, HHC's price/sales ratio has gone down 8.2.
Below are key valuation metrics over time for HHC.
Stock | Date | P/S | P/B | P/E | EV/EBIT |
---|---|---|---|---|---|
HHC | 2023-05-11 | 2.3 | 1.1 | 23.5 | 22.6 |
HHC | 2023-05-10 | 2.4 | 1.1 | 23.6 | 22.7 |
HHC | 2023-05-09 | 2.4 | 1.1 | 23.5 | 22.6 |
HHC | 2023-05-08 | 2.4 | 1.1 | 24.0 | 22.9 |
HHC | 2023-05-05 | 2.4 | 1.1 | 20.7 | 21.1 |
HHC | 2023-05-04 | 2.3 | 1.0 | 20.1 | 20.8 |
HHC Growth Metrics
- Its 4 year cash and equivalents growth rate is now at 128.75%.
- Its year over year net cashflow from operations growth rate is now at -255.3%.
- The 5 year revenue growth rate now stands at 9.22%.

The table below shows HHC's growth in key financial areas (numbers in millions of US dollars).
Date | Revenue | Operating Cash Flow | Net Income to Common Stock |
---|---|---|---|
2022-12-31 | 1,608.488 | 325.254 | 184.533 |
2022-09-30 | 1,932.159 | -28.054 | 245.582 |
2022-06-30 | 1,511.798 | -299.25 | 141.539 |
2022-03-31 | 1,447.547 | -299.976 | 124.816 |
2021-12-31 | 1,427.901 | -283.958 | 56.1 |
2021-09-30 | 835.926 | 56.53 | -64.346 |
HHC's Quality Factors
The “Quality” component of the POWR Ratings focuses on 31 different factors of a companies fundamentals and operational strength. Here are some key insights as we drill into the specifics of these quality attributes.- HHC has a Quality Grade of D, ranking ahead of 17.11% of graded US stocks.
- HHC's asset turnover comes in at 0.09 -- ranking 233rd of 444 Trading stocks.
- ALEX, ARCC, and VTR are the stocks whose asset turnover ratios are most correlated with HHC.
The table below shows HHC's key quality metrics over time.
Period | Asset Turnover | Gross Margin | ROIC |
---|---|---|---|
2021-09-30 | 0.090 | 0.393 | 0.005 |
2021-06-30 | 0.084 | 0.391 | 0.019 |
2021-03-31 | 0.078 | 0.385 | 0.015 |
2020-12-31 | 0.077 | 0.300 | 0.010 |
2020-09-30 | 0.086 | 0.314 | 0.009 |
2020-06-30 | 0.098 | 0.327 | -0.003 |
HHC Price Target
For more insight on analysts targets of HHC, see our HHC price target page. And for a list of of all stocks sorted by upside potential based on analyst target price, see our Top Price Target page.
Average Price Target | $129.00 | Average Broker Recommendation | 1.33 (Strong Buy) |
Howard Hughes Corp. (HHC) Company Bio
Howard Hughes Corporation develops and operates master planned communities, and mixed-use and other real estate properties in the United States. The company was founded in 2010 and is based in Dallas, Texas.
Latest HHC News From Around the Web
Below are the latest news stories about HOWARD HUGHES CORP that investors may wish to consider to help them evaluate HHC as an investment opportunity.
3 Stocks That Company Insiders Can’t Get Enough OfBuying stocks that insiders can't get enough of makes sense because insiders have more information than anyone else. |
8 Best Stocks to Buy in 2023 According to Bill AckmanIn this article, we discuss the 8 best stocks to buy in 2023 according to Bill Ackman. To skip the detailed history of Bill Ackman and his hedge fund’s performance, go directly to the 4 Best Stocks to Buy in 2023 According to Bill Ackman. Bill Ackman manages and owns the New York-based hedge fund […] |
Howard Hughes First Quarter 2023 Earnings: EPS Beats Expectations, Revenues LagHoward Hughes ( NYSE:HHC ) First Quarter 2023 Results Key Financial Results Revenue: US$196.3m (down 6.6% from 1Q... |
Q1 2023 Howard Hughes Corp Earnings CallQ1 2023 Howard Hughes Corp Earnings Call |
THE HOWARD HUGHES CORPORATION® REPORTS FIRST QUARTER 2023 RESULTSThe Howard Hughes Corporation® (NYSE: HHC) (the "Company," "HHC" or "we") today announced operating results for the first quarter ended March 31, 2023. The financial statements, exhibits, and reconciliations of non-GAAP measures in the attached Appendix and the Supplemental Information, as available through the Investors section of our website, provide further detail of these results. |
HHC Price Returns
1-mo | 1.30% |
3-mo | -7.21% |
6-mo | 6.11% |
1-year | -4.53% |
3-year | 27.70% |
5-year | -41.96% |
YTD | 1.60% |
2022 | -24.92% |
2021 | 28.95% |
2020 | -37.75% |
2019 | 29.89% |
2018 | -25.63% |
Continue Researching HHC
Want to do more research on Howard Hughes Corp's stock and its price? Try the links below:Howard Hughes Corp (HHC) Stock Price | Nasdaq
Howard Hughes Corp (HHC) Stock Quote, History and News - Yahoo Finance
Howard Hughes Corp (HHC) Stock Price and Basic Information | MarketWatch
Loading social stream, please wait...