
Huntington Ingalls Industries Inc. (HII): Price and Financial Metrics
HII Price/Volume Stats
| Current price | $276.03 | 52-week high | $299.50 |
| Prev. close | $273.95 | 52-week low | $199.11 |
| Day low | $273.40 | Volume | 297,115 |
| Day high | $277.67 | Avg. volume | 301,744 |
| 50-day MA | $252.51 | Dividend yield | 1.95% |
| 200-day MA | $257.61 | Market Cap | 10.88B |
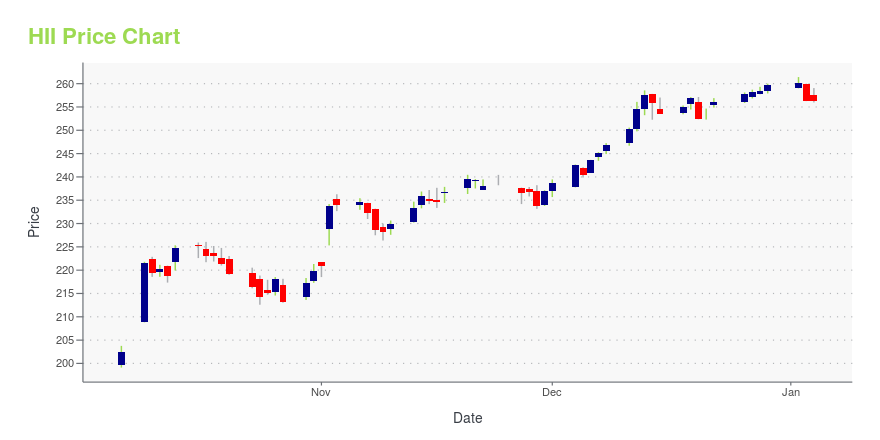
HII Stock Price Chart Interactive Chart >
Huntington Ingalls Industries Inc. (HII) Company Bio
Huntington Ingalls Industries (HII) is the largest military shipbuilding company in the United States as well as a provider of professional services to partners in government and industry. HII, ranked No. 371 on the Fortune 500, was formed on March 31, 2011, as a spin-off of Northrop Grumman. (Source:Wikipedia)
Latest HII News From Around the Web
Below are the latest news stories about HUNTINGTON INGALLS INDUSTRIES INC that investors may wish to consider to help them evaluate HII as an investment opportunity.
New to Investing? This 1 Aerospace Stock Could Be the Perfect Starting PointWondering how to pick strong, market-beating stocks for your investment portfolio? Look no further than the Zacks Focus List. |
HII’s Ingalls Shipbuilding Authenticates Keel of Destroyer George M. Neal (DDG 131)George M Neal (DDG 131) Keel Authentication Ingalls Structural Welder Morris Johnson welds the initials of Mrs. Kelley Neal Gray onto the keel plate that will be permanently part of George M. Neal (DDG 131). PASCAGOULA, Miss., Dec. 15, 2023 (GLOBE NEWSWIRE) -- HII’s (NYSE: HII) Ingalls Shipbuilding announced today the keel authentication of the Arleigh Burke-class (DDG 51) guided missile destroyer George M. Neal (DDG 131). The ship’s name honors George M. Neal, a Korean War veteran and an aviati |
Has Huntington Ingalls Industries, Inc.'s (NYSE:HII) Impressive Stock Performance Got Anything to Do With Its Fundamentals?Huntington Ingalls Industries (NYSE:HII) has had a great run on the share market with its stock up by a significant 21... |
HII Dedicates 20th and 21st Habitat for Humanity HomesNNS Habitat for Humanity Dedication 2023 A dedication ceremony and ribbon cutting was held Tuesday, December 12, 2023 for the 20th and 21st houses volunteers from HII’s Newport News Shipbuilding division have constructed in partnership with Habitat for Humanity Peninsula and Greater Williamsburg since 2002 (Photo by Ashley Cowan/HII). NEWPORT NEWS, Va., Dec. 12, 2023 (GLOBE NEWSWIRE) -- HII (NYSE: HII) announced today that the company’s Newport News Shipbuilding (NNS) division joined elected off |
Why This 1 Aerospace Stock Could Be a Great Addition to Your PortfolioFinding strong, market-beating stocks with a positive earnings outlook becomes easier with the Focus List, a top feature of the Zacks Premium portfolio service. |
HII Price Returns
| 1-mo | 10.61% |
| 3-mo | 0.18% |
| 6-mo | 9.03% |
| 1-year | 22.22% |
| 3-year | 44.35% |
| 5-year | 31.66% |
| YTD | 7.35% |
| 2023 | 15.16% |
| 2022 | 26.33% |
| 2021 | 12.11% |
| 2020 | -30.46% |
| 2019 | 34.00% |
HII Dividends
| Ex-Dividend Date | Type | Payout Amount | Change | ||||||
|---|---|---|---|---|---|---|---|---|---|
| Loading, please wait... | |||||||||
Continue Researching HII
Here are a few links from around the web to help you further your research on Huntington Ingalls Industries Inc's stock as an investment opportunity:Huntington Ingalls Industries Inc (HII) Stock Price | Nasdaq
Huntington Ingalls Industries Inc (HII) Stock Quote, History and News - Yahoo Finance
Huntington Ingalls Industries Inc (HII) Stock Price and Basic Information | MarketWatch
Loading social stream, please wait...