Highwoods Properties, Inc. (HIW): Price and Financial Metrics
HIW Price/Volume Stats
Current price | $20.61 | 52-week high | $31.88 |
Prev. close | $20.53 | 52-week low | $19.45 |
Day low | $20.42 | Volume | 983,700 |
Day high | $20.99 | Avg. volume | 1,189,687 |
50-day MA | $23.37 | Dividend yield | 9.9% |
200-day MA | $24.52 | Market Cap | 2.18B |
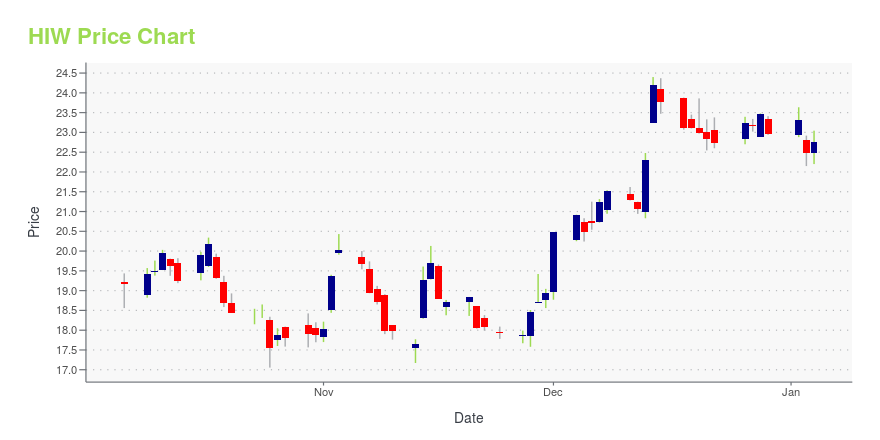
HIW Stock Price Chart Interactive Chart >
HIW POWR Grades
- HIW scores best on the Value dimension, with a Value rank ahead of 70.42% of US stocks.
- The strongest trend for HIW is in Growth, which has been heading down over the past 177 days.
- HIW's current lowest rank is in the Growth metric (where it is better than 5.12% of US stocks).
HIW Stock Summary
- HIGHWOODS PROPERTIES INC's stock had its IPO on June 8, 1994, making it an older stock than 76.27% of US equities in our set.
- Of note is the ratio of HIGHWOODS PROPERTIES INC's sales and general administrative expense to its total operating expenses; just 4.47% of US stocks have a lower such ratio.
- The ratio of debt to operating expenses for HIGHWOODS PROPERTIES INC is higher than it is for about 92.25% of US stocks.
- Stocks that are quantitatively similar to HIW, based on their financial statements, market capitalization, and price volatility, are TRTN, PLYM, AQN, NSA, and CUBE.
- Visit HIW's SEC page to see the company's official filings. To visit the company's web site, go to www.highwoods.com.
HIW Valuation Summary
- In comparison to the median Real Estate stock, HIW's price/sales ratio is 163.64% higher, now standing at 2.9.
- HIW's price/sales ratio has moved up 0.1 over the prior 243 months.
Below are key valuation metrics over time for HIW.
Stock | Date | P/S | P/B | P/E | EV/EBIT |
---|---|---|---|---|---|
HIW | 2023-09-20 | 2.9 | 1 | 15.9 | 20.1 |
HIW | 2023-09-19 | 2.9 | 1 | 15.8 | 20.1 |
HIW | 2023-09-18 | 2.8 | 1 | 15.7 | 20.0 |
HIW | 2023-09-15 | 2.9 | 1 | 15.9 | 20.1 |
HIW | 2023-09-14 | 2.9 | 1 | 15.9 | 20.1 |
HIW | 2023-09-13 | 2.8 | 1 | 15.5 | 19.9 |
HIW Growth Metrics
- Its year over year net cashflow from operations growth rate is now at 7.45%.
- Its 5 year net income to common stockholders growth rate is now at 159.09%.
- Its 5 year price growth rate is now at -26.75%.

The table below shows HIW's growth in key financial areas (numbers in millions of US dollars).
Date | Revenue | Operating Cash Flow | Net Income to Common Stock |
---|---|---|---|
2022-12-31 | 828.929 | 421.779 | 156.572 |
2022-09-30 | 820.421 | 425.219 | 253.944 |
2022-06-30 | 808.919 | 419.041 | 287.798 |
2022-03-31 | 790.58 | 405.656 | 296.592 |
2021-12-31 | 768.007 | 414.558 | 310.791 |
2021-09-30 | 744.706 | 391.919 | 267.978 |
HIW's Quality Factors
The “Quality” component of the POWR Ratings focuses on 31 different factors of a companies fundamentals and operational strength. Here are some key insights as we drill into the specifics of these quality attributes.- HIW has a Quality Grade of C, ranking ahead of 58.72% of graded US stocks.
- HIW's asset turnover comes in at 0.139 -- ranking 134th of 444 Trading stocks.
- GBCS, HST, and OPY are the stocks whose asset turnover ratios are most correlated with HIW.
The table below shows HIW's key quality metrics over time.
Period | Asset Turnover | Gross Margin | ROIC |
---|---|---|---|
2021-09-30 | 0.139 | 0.690 | 0.045 |
2021-06-30 | 0.140 | 0.689 | 0.042 |
2021-03-31 | 0.141 | 0.690 | 0.039 |
2020-12-31 | 0.143 | 0.685 | 0.057 |
2020-09-30 | 0.146 | 0.683 | 0.054 |
2020-06-30 | 0.149 | 0.676 | 0.054 |
HIW Price Target
For more insight on analysts targets of HIW, see our HIW price target page. And for a list of of all stocks sorted by upside potential based on analyst target price, see our Top Price Target page.
Average Price Target | $49.63 | Average Broker Recommendation | 1.61 (Moderate Buy) |
Highwoods Properties, Inc. (HIW) Company Bio
Highwoods Properties focuses on building its portfolio of office, industrial, and retail properties. The company was founded in 1978 and is based in Raleigh, North Carolina.
Latest HIW News From Around the Web
Below are the latest news stories about HIGHWOODS PROPERTIES INC that investors may wish to consider to help them evaluate HIW as an investment opportunity.
Blackstone and Airbnb Set to Join S&P 500; Others to Join S&P 100, S&P MidCap 400 and S&P SmallCap 600S&P Dow Jones Indices ("S&P DJI") will make the following changes to the S&P 500, S&P 100, S&P MidCap 400 and S&P SmallCap 600 indices effective prior to the open of trading on Monday, September 18, to coincide with the quarterly rebalance. The changes ensure each index is more representative of its market capitalization range. All companies being added to the S&P MidCap 400 are more representative of the mid-cap market space, and all companies being added to the S&P SmallCap 600 are more repres |
Raleigh's N&O vacates storefront space downtownThe News & Observer has vacated some of its office space in Downtown Raleigh. The newspaper's storefront space on the ground floor at One City Plaza on Fayetteville Street is completely empty. Highwoods Properties (NYSE: HIW) owns the building at 421 Fayetteville St. and doesn’t have any current available listings for the ground floor or the suite that the N&O is in, suite 104. |
10 Dividend Stocks with Over 8% YieldIn this article, we discuss 10 dividend stocks with over 8% yield. You can skip our detailed analysis of high dividend yield stocks and their performance in the past, and go directly to read 5 Dividend Stocks with Over 8% Yield. Stocks with higher dividend yields have historically performed better than those with lower yields […] |
Highwoods Properties (HIW) Reports Q2 Earnings: What Key Metrics Have to SayThe headline numbers for Highwoods Properties (HIW) give insight into how the company performed in the quarter ended June 2023, but it may be worthwhile to compare some of its key metrics to Wall Street estimates and the year-ago actuals. |
Highwoods Properties (HIW) Q2 2023 Earnings Call TranscriptJoining me on the call this morning are Ted Klinck, our chief executive officer; Brian Leary, our chief operating officer; and Brendan Maiorana, our chief financial officer. On today's call, our review will include non-GAAP measures such as FFO, NOI and EBITDAre. |
HIW Price Returns
1-mo | -13.51% |
3-mo | -11.87% |
6-mo | -6.36% |
1-year | -17.06% |
3-year | -26.56% |
5-year | -42.59% |
YTD | -21.48% |
2022 | -33.58% |
2021 | 17.63% |
2020 | -14.76% |
2019 | 31.82% |
2018 | -20.83% |
HIW Dividends
Ex-Dividend Date | Type | Payout Amount | Change | ||||||
---|---|---|---|---|---|---|---|---|---|
Loading, please wait... |
Continue Researching HIW
Want to see what other sources are saying about Highwoods Properties Inc's financials and stock price? Try the links below:Highwoods Properties Inc (HIW) Stock Price | Nasdaq
Highwoods Properties Inc (HIW) Stock Quote, History and News - Yahoo Finance
Highwoods Properties Inc (HIW) Stock Price and Basic Information | MarketWatch
Loading social stream, please wait...