Houlihan Lokey, Inc. (HLI): Price and Financial Metrics
GET POWR RATINGS... FREE!
HLI POWR Grades
- Quality is the dimension where HLI ranks best; there it ranks ahead of 97.52% of US stocks.
- The strongest trend for HLI is in Quality, which has been heading up over the past 179 days.
- HLI's current lowest rank is in the Sentiment metric (where it is better than 10.15% of US stocks).
HLI Stock Summary
- For HLI, its debt to operating expenses ratio is greater than that reported by merely 15.24% of US equities we're observing.
- Over the past twelve months, HLI has reported earnings growth of 91.72%, putting it ahead of 78.95% of US stocks in our set.
- Revenue growth over the past 12 months for Houlihan Lokey Inc comes in at 73.23%, a number that bests 88.28% of the US stocks we're tracking.
- Stocks that are quantitatively similar to HLI, based on their financial statements, market capitalization, and price volatility, are NVEE, III, FNKO, HUBG, and MHH.
- HLI's SEC filings can be seen here. And to visit Houlihan Lokey Inc's official web site, go to www.hl.com.
HLI Valuation Summary
- In comparison to the median Financial Services stock, HLI's price/sales ratio is 12.5% higher, now standing at 3.6.
- HLI's price/earnings ratio has moved down 1 over the prior 73 months.
Below are key valuation metrics over time for HLI.
Stock | Date | P/S | P/B | P/E | EV/EBIT |
---|---|---|---|---|---|
HLI | 2019-04-16 | 3.0 | 3.7 | 20.6 | 12.9 |
HLI | 2018-07-03 | 3.6 | 4.0 | 19.9 | 14.4 |
HLI | 2018-03-06 | 3.1 | 3.7 | 18.0 | 13.3 |
HLI | 2017-12-04 | 3.1 | 3.8 | 21.0 | 12.7 |
HLI | 2017-11-15 | 2.9 | 3.6 | 19.9 | 12.0 |
HLI | 2016-07-12 | 2.2 | 2.3 | 21.7 | 11.3 |
HLI Growth Metrics
- Its 4 year cash and equivalents growth rate is now at 129.13%.
- Its 5 year cash and equivalents growth rate is now at 129.13%.
- Its 4 year revenue growth rate is now at 67.11%.

The table below shows HLI's growth in key financial areas (numbers in millions of US dollars).
Date | Revenue | Operating Cash Flow | Net Income to Common Stock |
---|---|---|---|
2021-12-31 | 2,299.496 | 944.788 | 471.944 |
2021-09-30 | 1,948.574 | 701.285 | 416.724 |
2021-06-30 | 1,687.038 | 604.984 | 352.631 |
2021-03-31 | 1,525.452 | 579.837 | 312.771 |
2020-12-31 | 1,327.442 | 484.095 | 272.419 |
2020-09-30 | 1,123.081 | 273.196 | 202.798 |
HLI's Quality Factors
The “Quality” component of the POWR Ratings focuses on 31 different factors of a companies fundamentals and operational strength. Here are some key insights as we drill into the specifics of these quality attributes.- HLI has a Quality Grade of B, ranking ahead of 93.44% of graded US stocks.
- HLI's asset turnover comes in at 0.791 -- ranking 24th of 442 Trading stocks.
- PSA, LIVE, and SITC are the stocks whose asset turnover ratios are most correlated with HLI.
The table below shows HLI's key quality metrics over time.
Period | Asset Turnover | Gross Margin | ROIC |
---|---|---|---|
2021-06-30 | 0.791 | 1 | 0.616 |
2021-03-31 | 0.755 | 1 | 0.538 |
2020-12-31 | 0.724 | 1 | 0.486 |
2020-09-30 | 0.666 | 1 | 0.385 |
2020-06-30 | 0.704 | 1 | 0.373 |
2020-03-31 | 0.766 | 1 | 0.398 |
HLI Price Target
For more insight on analysts targets of HLI, see our HLI price target page. And for a list of of all stocks sorted by upside potential based on analyst target price, see our Top Price Target page.
Average Price Target | $75.00 | Average Broker Recommendation | 2.19 (Hold) |
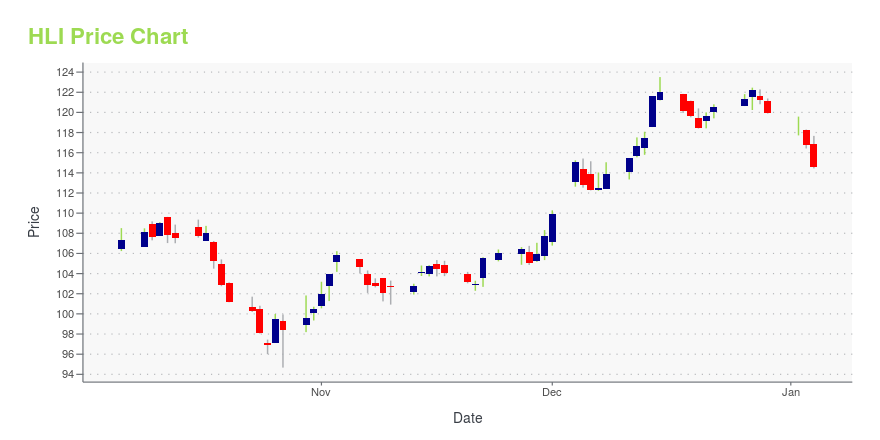
HLI Stock Price Chart Interactive Chart >
HLI Price/Volume Stats
Current price | $81.32 | 52-week high | $122.62 |
Prev. close | $78.35 | 52-week low | $76.27 |
Day low | $78.56 | Volume | 654,500 |
Day high | $81.32 | Avg. volume | 423,042 |
50-day MA | $83.58 | Dividend yield | 2.71% |
200-day MA | $97.71 | Market Cap | 5.41B |
Houlihan Lokey, Inc. (HLI) Company Bio
Houlihan Lokey focuses on mergers and acquisitions, financings, financial restructurings and financial advisory services. The Company operates in three segments: Corporate Finance, Financial Restructuring and Financial Advisory Services. The company was founded in 1972 and is based in Los Angeles, California.
Latest HLI News From Around the Web
Below are the latest news stories about Houlihan Lokey Inc that investors may wish to consider to help them evaluate HLI as an investment opportunity.
Houlihan Lokey Announces Rebranding of GCA in Japan and the Asia-Pacific RegionLOS ANGELES, CA / ACCESSWIRE / February 24, 2022 / Houlihan Lokey (NYSE:HLI), the global investment bank, recently announced the rebranding of GCA Group (GCA) in Japan and its other operations in the Asia-Pacific region, joining their colleagues around the world under the Houlihan Lokey banner. The acquisition of GCA was completed late last year, and the two firms have been operating together under the Houlihan Lokey brand in Europe and the United States since December 2021. |
Zacks.com featured highlights include Diodes, Houlihan Lokey, Skyline and Cavco IndustriesDiodes, Houlihan Lokey, Skyline and Cavco Industries are included in this blog. |
Credito Real Bondholders Tap Adviser for Restructuring Talks(Bloomberg) -- A group of Credito Real SAB bondholders has engaged Los Angeles-based investment bank Houlihan Lokey Inc. to help advise them in restructuring talks with the Mexican shadow lender, according to people with knowledge of the matter.Most Read from BloombergJapan’s Kishida Speaks With Putin on Crisis: Ukraine UpdateElon Musk Ratchets Up Trudeau Criticism With Hitler Comparison MemeMoney That Won Melania Trump NFT Came From Melania Trump WalletStocks Tumble, Bonds Rally in Flight-to-Sa |
Houlihan Lokey (HLI) is an Incredible Growth Stock: 3 Reasons WhyHoulihan Lokey (HLI) could produce exceptional returns because of its solid growth attributes. |
Mastercard's (MA) Latest Launch to Simplify Payments in BahrainMastercard (MA) teams up with Payment International to provide seamless transaction services to customers in the Kingdom of Bahrain. |
HLI Price Returns
1-mo | -2.35% |
3-mo | -8.53% |
6-mo | -22.10% |
1-year | 2.54% |
3-year | 98.60% |
5-year | 164.11% |
YTD | -20.63% |
2021 | 57.04% |
2020 | 40.61% |
2019 | 36.33% |
2018 | -17.20% |
2017 | 49.30% |
HLI Dividends
Ex-Dividend Date | Type | Payout Amount | Change | ||||||
---|---|---|---|---|---|---|---|---|---|
Loading, please wait... |
Continue Researching HLI
Here are a few links from around the web to help you further your research on Houlihan Lokey Inc's stock as an investment opportunity:Houlihan Lokey Inc (HLI) Stock Price | Nasdaq
Houlihan Lokey Inc (HLI) Stock Quote, History and News - Yahoo Finance
Houlihan Lokey Inc (HLI) Stock Price and Basic Information | MarketWatch
Loading social stream, please wait...